AMD has further improved their IGP solution from the 785G boards with the new 890GX. However the GX is a higher end product which includes the 4290 IGP, and Crossfire support. Lets take a look at how the SB850 and 4290 perform.
Introduction
While AMD has pushed their GX boards as mid range parts, they still come with higher end IGP solutions. Today we have AMD’s latest addition to the GX family, the 890GX. This motherboard comes with a 4290 IGP, which performs better than the previously released 4200. This should be a nice addition for users looking for higher quality on board graphics. This board also supports Crossfire, which provides a great upgrade path if you would like to slowly upgrade your computer as games become more demanding.
The 890GX also comes with full support of every AM3 CPU released to date, and plans to keep the chipset in production as long as the AM3 socket is still AMD’s primary desktop socket. As with most of the previous 790 series boards the 890 uses DDR3, so you won’t have the option of running an AM2 CPU. This puts a spoil on anyone who was hoping to keep their AM2 CPU going into the newest chipsets.
The biggest advance of the 890GX is its addition of the SB850. The last time AMD released a new South Bridge overclocking potential was greatly increased, so it would be nice to see the same result here. However we are not expecting to see a large increase in overclocking. The 890GX also has added support for SATA 6 GB/s. This support for the latest technology is nice to see, as it shows that AMD is keeping their chipsets on the front line of technology.
![]()
![]()
Features
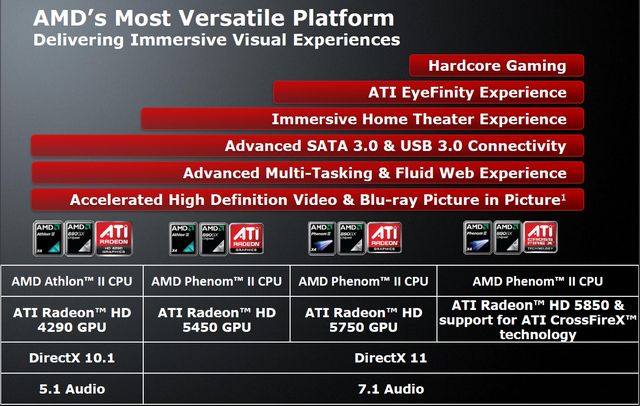
AMD is really pushing the 890GX motherboard as the most versatile motherboard it has ever created. The board occupies a large range of different tasks from basic HD video playing to hardcore gaming. Your performance will vary depending on how much you want to spend, but AMD aims to provide every user the perfect performance with this new chipset.
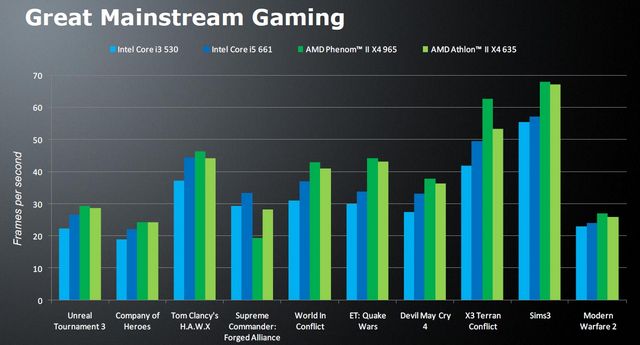
One of the most important aspects for many people is casual gaming. As we see here, AMD testing has showed that their platform provides better frame rates. This testing was done by AMD, so many of you will take it with a grain of salt, but if these results are true AMD could have a real winning platform on their hand.
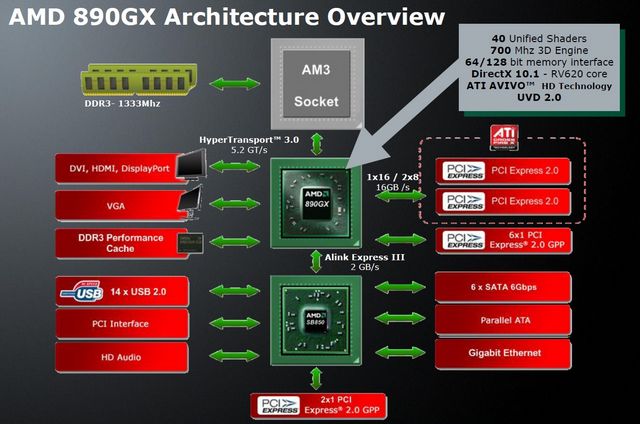
Here we have a quick schematic of the architecture. As with all CPU’s with a memory controller onboard, the memory is fed directly to the CPU increasing bandwidth. All of your PCIE 2.0 ports are connected directly to the 890GX chip itself. This link has 16 GB/s of bandwidth, which is a pretty sizable number. The 4290 graphics themselves have 40 unified shaders running at 700 MHz. This is not a whole lot of power, but its a sizable leap over the 4200 found in the 785G chipset. A quick note about the 4290, almost all of the 890GX boards are set to have Sideport memory, which means your integrated wont be hogging your system RAM. AMD’s new south bridge, named the SB850, connects all of your SATA ports, USB, PCI, ect, to the rest of the system. It is connected to the 890GX via a 2 GB/s connection called the Alink Express III. Finally we have the 890GX communicating with the CPU via HyperTransport 3.0, which blazes along at 5.2 GT/s.
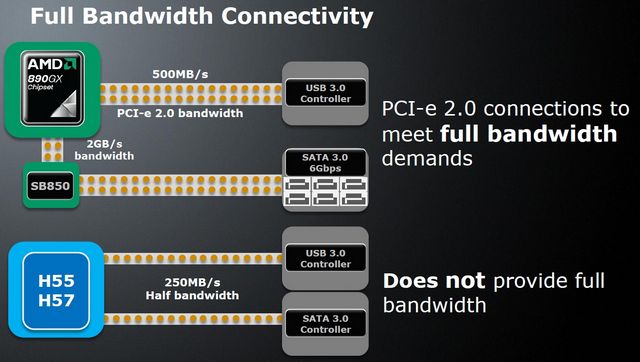
This time around AMD is pushing its bandwidth advantage over Intel. Now many will say, but wait Intel easily beats AMD. You have to take into consideration that the 1366 platform is much more expensive. When compared to the similar H55 and H57 chipsets the 890GX provides much more bandwidth. This should increase not only PCIE 2.0 performance, but SATA 6 Gbps, and USB3.0.
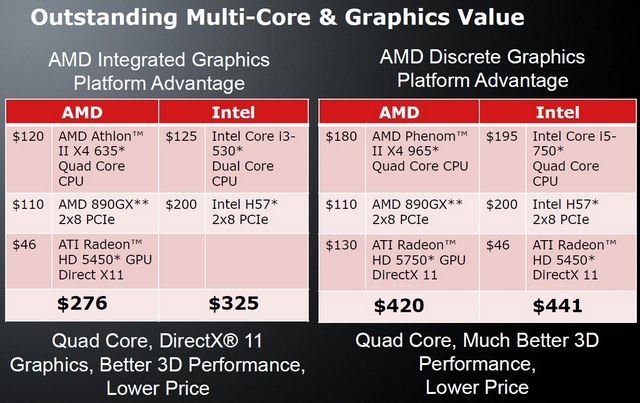
AMD has conveniently compared the prices of their systems to similar Intel systems. As you can see here the AMD system comes out cheaper, and according to AMD will outperform its Intel competitor. The main area where AMD comes out cheaper is the motherboard price. The Intel H57 is almost double the 890GX. However AMD fails to put in the cheapest H57 board because of their lack of true 8x PCIE support. Cheaper micro ATX H57 motherboards happen to run about the same price, but graphics performance may be reduced.
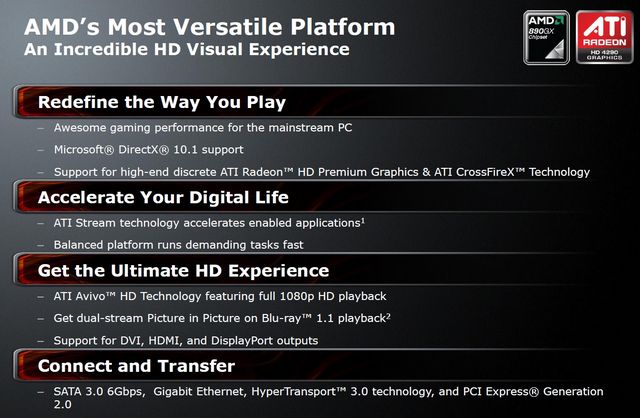
Expanding on the versatileness of this platform we have this slide. The 890GX’s 4290 has DX10.1 support built in which will allow you to play the latest games, and continue to be able to play games when developers begin to migrate to DX10. The motherboard has support for the latest high end hardware, but yet be cheap which is hard to find no a days. AMD is also pushing HD content which is becoming a bigger deal every year. With Blu Ray becoming cheaper we will soon see it overtake the DVD as the standard for movies as well as games.
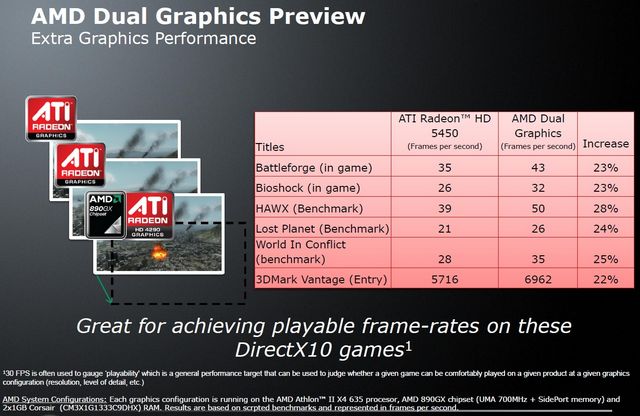
Finally we have a feature that AMD and Nvidia have had for awhile. The ability to run graphics cards with onboard is nothing new, but for many people this improves their performance while being easy on their wallets. According to AMD this difference amounts to anywhere between 22-28%. Thats not bad for something thats just sitting around on your motherboard doing nothing. In many cases this puts a game from the almost playable zone into the completely playable zone.
Specifications
| Feature/Specification | 790GX | 890GX | 790FX |
|---|---|---|---|
| Memory Standard |
DDR3/2 |
DDR3 | DDR3/2 |
| Memory Slots |
4 | 4 | 4 |
| SATA 6 Gb/s |
N (On some) |
Y | N (On some) |
| USB 3 |
N (On some) |
Y | N (On some) |
| CPU Support |
AM2/3 |
AM3 | AM2/3 |
Stats wise these chipsets are similar. Some of the newer 790GX/FX boards are coming with USB 3 and SATA 6Gb/s controllers. The 890 GX however nativity supports SATA 6 Gb/s, and you can bet that every one will include USB 3 support. The 890 GX also drops support for AM2 since it drops DDR2 at this time. However a board partner may decide to release a DDR2 board, which would most likely have AM2 CPU support.
Pictures & Impressions
Today we bring you two separate 890GX boards. This will give you a good idea of the layout of other 890GX boards. First up is the Asus M4A89GTD Pro.

Here we have Asus’s box. Expect every manufacturer to use a similar sized box, and include the main features as highlighted on this box.

When we open the box we are greeted on the right by a manual, and on the left with the included accessories. There is a cardboard layer separating these items from the motherboard to ensure that no harm comes to the motherboard. This is pretty standard packaging, so lets move onto the main attraction.

The 890GX looks very similar to any AMD chipset based board on the market currently. Asus has decided to continue to use their radical design on the heatsinks. The strange design baffles us, as many times it seems to be more ascetically pleasing than functional. The color scheme looks pretty good. We are a fan of the darker blue color, but Asus has been going with a Baby Blue color lately.

The first thing that caught our eyes was the jumper chip. This top PCIE slot actually runs at 8x. This is as much of a clarification to the system builder, as it is a functional card. Below this we can see that this board supports 140w CPU’s, which is great news since AMD’s higher end CPU’s are high wattage.

On the left you can see the SATA 6Gb/s ports. There are four of them (which happens to be more than whats on the P6X58D), so you should not run out anytime soon. As you move to the right you will see two 180 degree SATA ports, and just above that is the age old IDE.

Asus went with an interesting RAM slot design. The left side clips do not move at all. As with other AMD boards, this board comes equipped with four slots.

Now for a closeup of the VRM’s. Asus has a full cover heatsink, which is always nice too see. There should be no cooling issues on this motherboard. You can also see a raised 8 pin CPU power connector. We can’t say we have ever seen this before, but it makes plugging the cable in that much easier.

The back I/O looks pretty standard for any motherboard with an IGP. Starting from the left we have your standard PS/2 port for older mice or keyboards. Under this are two USB ports. Then we have the Optical audio output, and HDMI. Your standard VGA and DVI connections are right next to those, and another two USB ports, a 1394 port, and an eSATA port are to the right. A single ethernet connection, two USB 3.0, and finally the 8 channel audio.

Now to take a look at the Gigabyte 890GPA-UD3H. The layout looks very similar to the Asus 890GX. The only real difference from a quick glance is the different color scheme. The Asus color scheme looks a little better to us, but the Gigabyte definitely doesn’t look ugly.

The slot layout is almost identical to the Asus board. The main difference is the bottom PCIE 1x slot is a PCIE 4x slot on the Asus motherboard. Those who are looking for dual graphics cards, and the ability to run a PCIE 4x RAID card would be better off looking at the Asus 890GX. The Gigabyte board is also lacking the jumper that is on the Asus board. The bottom slot still functions as the main slot on this board. This is most likely a chipset design, so every 890GX should be set up the same.

Gigabyte has decided to one up Asus here however. They include two more SATA 6Gb/s ports. All of the SATA ports are 180 degree’s as well, which is a plus in our book. The two white SATA connectors are controlled by Gigabytes own onboard SATA controller.

Gigabyte has opted to go with the regular RAM clips, which is probably what every other manufacture expect Asus will do. Most likely Asus has a patent on the clip design, and is hoarding it all for themselves. You can also see the included IDE port right next to the RAM slots. No manufacture seems to be ready to just let IDE die quite yet.

The heatsink design is pretty similar to Asus’s design. Both motherboards provide plenty of area to dissipate heat. The Gigabyte board happens to be lacking the extended 8 pin connector that the Asus board had. This will make it harder to plug in, but you should be able to better hide the cable if you choose to do so.

The layout is pretty similar to the Asus board, but in a different order. The inclusion of the covers for the video connectors is a nice touch that shows Gigabyte cares about the consumer. Now that we have had a good look at a couple of 890GX motherboards lets take a look at how they perform.
Methodology
To test the AMD 890GX boards we used the same components in every machine. The only component we switched was the motherboard. We did a fresh load of Windows 7 Ultimate on the test rig. Keeping the components the same across a variety of boards will ensure a level playing field for all the motherboards tested.
We’ve expanded our testing suite considerably for P55(A) and will continue to use the same tests across most of the motherboards and CPU’s we test. We run each test a total of at least three times minimum, some tests we run more than 3 times. We average the total of all the tests from each benchmark then report the average here.
The OS we use is Windows 7 Ultimate with all patches and updates applied. We also use the latest drivers available for the motherboard and any devices attached to the computer. We don’t disable a bunch of background tasks or particularly tweak the OS or system for bigger numbers. We do turn off drive indexing and daily defragging. We also turn off Prefetch and Superfetch. This is not an attempt to produce bigger benchmark numbers. Drive indexing and defragging can interfere with testing in that one test might occur without defragging going on and the next test defragging might be active, the same thing goes for drive indexing. We can’t control when defragging and indexing occur precisely enough to guarantee that they won’t interfere with testing, so we turn them off.
Prefetch tries to predict what you will load the next time you boot the machine. We disable it because we want to know how the program runs without any of the files being cached, otherwise each test run we’d have to clear pre-fetch to get accurate numbers. Lastly we disable Superfetch, Superfetch loads often used programs into memory and is one of the reasons people consider Vista to be such a memory hog. Vista fills the memory in an attempt to predict what you will load. Having one test run with files cached, and another test run with the files being un-cached would result in skewed numbers. Again since we can’t control it we turn it off. Other than those 4 things which can potentially interfere with benchmarking, and do so out of our control, we leave everything else running.
Test Rig
| Test Rig |
|
| Case Type | NZXT Hades |
| CPU | AMD Athlon 2 635 |
| Motherboard |
Asus M4A89GTD Pro |
| RAM | GSkill 4GB DDR3 1600 @ CAS 8 |
| CPU Cooler | Cooler Master TX-3 |
| Hard Drives | Western Digital SE16 640 GB |
| Optical | Lite-On DVD R/W |
| GPU(s) | Sapphire HD 5770 Vapor-X |
| Testing PSU | Corsair HX-850 |
Test Suite
| Synthetic Benchmarks & Games | |
| Everest 5.0 | |
| Winrar 3.9 | |
| POV Ray | |
| Excel | |
| Blender | |
| Cinebench R10 | |
| Vantage | |
| SiSoft Sandra 2010 | |
| HD Tach | |
| HD Tune Pro | |
| ATTO | |
| Far Cry 2 | |
Overclocking
After the huge disappointment our 770 and 790 X where at overclocking we where really hoping for a spectacular result for the new 890GX. Below you will find a CPUz screen shot of our highest speed and highest bus speed reached. Since multiplier overclocking is much easier on the board, you should easily be able to match these speeds with any Black Edition CPU.
To overclock we slowly brought up the bus speed. We briefly tested to make sure we where stable then moved on. We slowly bumped up the voltage trying to reach the maximum speed possible. Below are the CPUz screen shots.
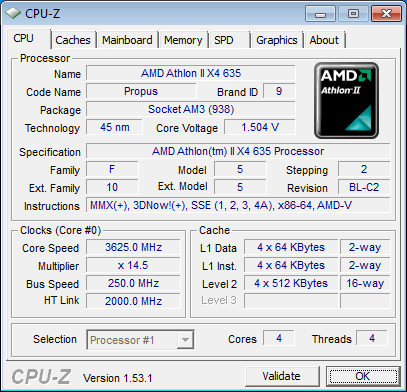
We must say that this is a great result. This is actually an increase of 5 MHz core from our all time high of 245 MHz on the Gigabyte 790 FX. This is certainly not a huge increase over the FX, but any improvement in overclocking is great to see no matter how small.
ATTO
ATTO is a little long in the tooth but still provides a good method of checking hard drive![]() performance. Since your comparing results from the same benchmark to other drives benched on the same software it provides a basis for comparison and in most cases provides reliable and reproducible results.
performance. Since your comparing results from the same benchmark to other drives benched on the same software it provides a basis for comparison and in most cases provides reliable and reproducible results.
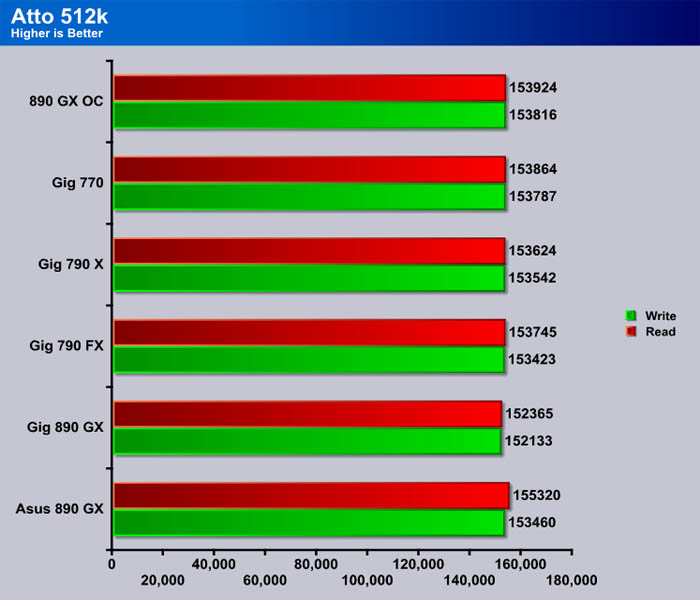
Starting off we see the motherboards in almost a stand still. All of the scores here are well within the margin of error.
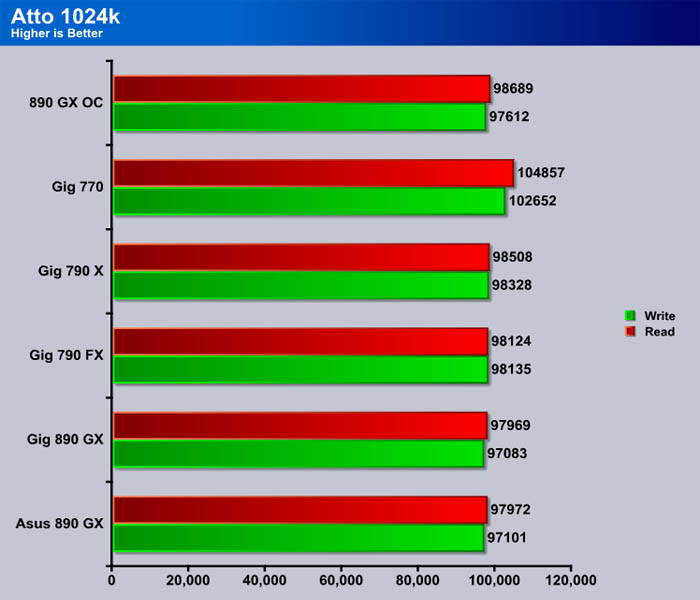
Again the scores are too close to call. The 770 seems to have the lead however. This is most likely one of those random anomalies, and you wont see any difference in the real world. If this system had a SSD then we might see a larger difference, but CPU’s have no trouble keeping up with the classic platter HDD’s.
HD TUNE PRO
HD Tune Pro is an extended version of HD Tune which includes many new features such as: write benchmark, secure erasing, AAM setting, folder usage view, disk monitor, command line parameters and file benchmark. HD Tune Pro is a computer benchmarking application that can test the performances of any PC.
Here are some key features of “HD Tune Pro”:
- Benchmark: measures the raw performance
- Transfer Rate
- Access Time
- CPU Usage
- Burst Rate
- Hard Disk information which includes firmware version, serial number, disk capacity, buffer size, transfer mode
- Hard Disk Health
- S.M.A.R.T. Information (Self-Monitoring Analysis and Reporting Technology)
- Temperature
- Power On Time
- Copy text to clipboard
- Copy screenshot to clipboard
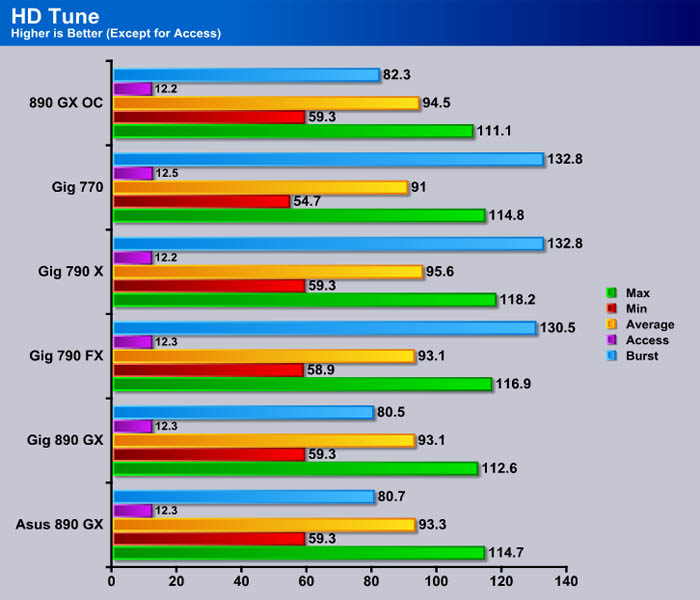
We normally break this graph up into a few different onces, but you can compare the boards faster than scrolling through a long list of charts. We see the 790 and 770 boards taking a clear lead in the burst category. Not sure whats up with the 890 boards, but they definitely where slacking on that. Every other category across testing was nearly identical.
HDTach
HD Tach is a physical performance hard drive test which utilizes a special kernel mode VXD in order to get maximum accuracy by bypassing the file system. A similar mechanism is used in Windows NT/2000.
The HD Tach sequential read test is a little bit different from other benchmarks. Most benchmarks create a file on the hard drive and test within that file.
The problem is that modern hard drives use a zone bit recording technique that allows different read speeds depending on where the data is located. Data on the outside of the drive is much faster than data recorded on the inside. SSD’s are freed from this limitation due to their Nans Flash technology.
HD Tach reads from areas all over the hard drive and reports an average speed. It also logs the read speeds to a text file that you can load into a spreadsheet and graph to visually read the results of the test.
In addition to sequential read, HD Tach tests the drive’s random access time. Random access is the true measure of seek speed. Many drives advertise sub 10 millisecond seek speeds, but seek speeds are misleading.
Finally, HD Tach tests the drive burst speed. The burst speed is the speed that data can be accessed from the drive’s on-board read-ahead memory. This measures the speed of the drive and controller interface.
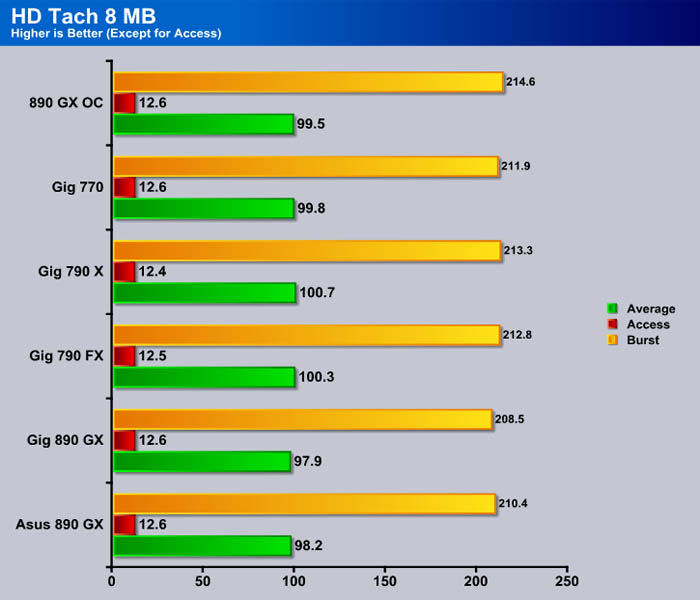
No surprises here as all the motherboards score about the same. This is due to the hard drive speed more than the boards themselves.
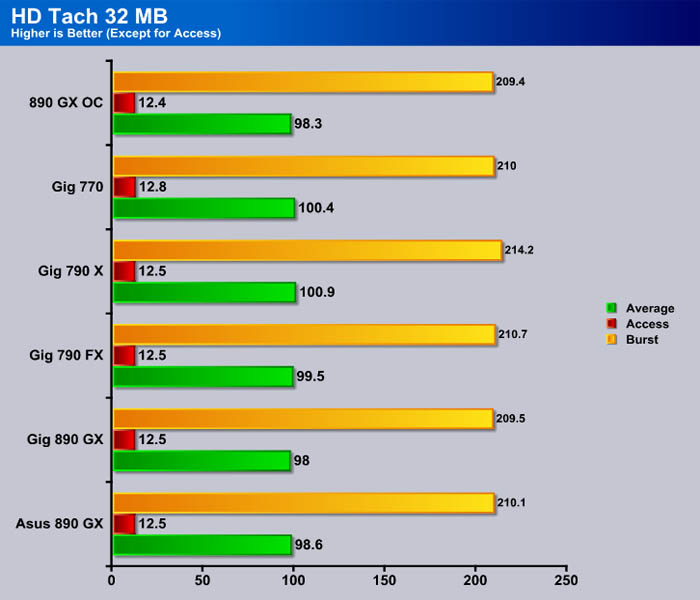
When we move to the 32 MB test we see the same results as before. Enough with these hard drive tests, lets get to the raw processing power of the CPU.
Everest Ultimate

“EVEREST Ultimate Edition is an industry leading system diagnostics and benchmarking solution for enthusiasts PC users, based on the award-winning EVEREST Technology. During system optimizations and tweaking it provides essential system and overclock information, advanced hardware monitoring and diagnostics capabilities to check the effects of the applied settings. CPU, FPU and memory benchmarks are available to measure the actual system performance and compare it to previous states or other systems. Furthermore, complete software, operating system and security information makes EVEREST Ultimate Edition a comprehensive system diagnostics tool that offers a total of 100 pages of information about your PC.”
CPU AES
This integer benchmark measures CPU performance using AES (a.k.a. Rijndael) data encryption. It utilizes Vincent Rijmen, Antoon Bosselaers and Paulo Barreto’s public domain C code in ECB mode.
CPU AES test uses only the basic x86 instructions, the test consumes 48 MB memory, and it is Hyper Threading, multi-processor (SMP) and multi-core (CMP) aware.
CPU PhotoWorxx
This integer benchmark performs different common tasks used during digital photo processing.
It performs the following tasks on a very large RGB image:
• Fill
• Flip
• Rotate90R (rotate 90 degrees CW)
• Rotate90L (rotate 90 degrees CCW)
• Random (fill the image with random colored pixels)
• RGB2BW (color to black & white conversion)
• Difference
• Crop
This benchmark stresses the integer arithmetic and multiplication execution units of the CPU and also the memory subsystem.
CPU PhotoWorxx test uses only the basic x86 instructions, and it is Hyper Threading, multi-processor (SMP) and multi-core (CMP) aware.
CPU Queen
This simple integer benchmark focuses on the branch prediction capabilities and the misprediction penalties of the CPU. It finds the solutions for the classic “Queens problem” on a 10 by 10 sized chessboard.
CPU Queen test uses integer MMX, SSE2 and SSSE3 optimizations. It consumes less than 1 MB system memory and it is Hyper Threading, multi-processor (SMP) and multi-core (CMP) aware.
CPU ZLib
This integer benchmark measures combined CPU and memory subsystem performance through the public ZLib compression library Version 1.2.3 (http://www.zlib.net).
CPU ZLib test uses only the basic x86 instructions, and it is Hyper Threading, multi-processor (SMP) and multi-core (CMP) aware.

As with the hard drive tests, all of the boards are quite close. When the CPU is overclocked it easily surpasses the stock clocked boards.
Everest Memory
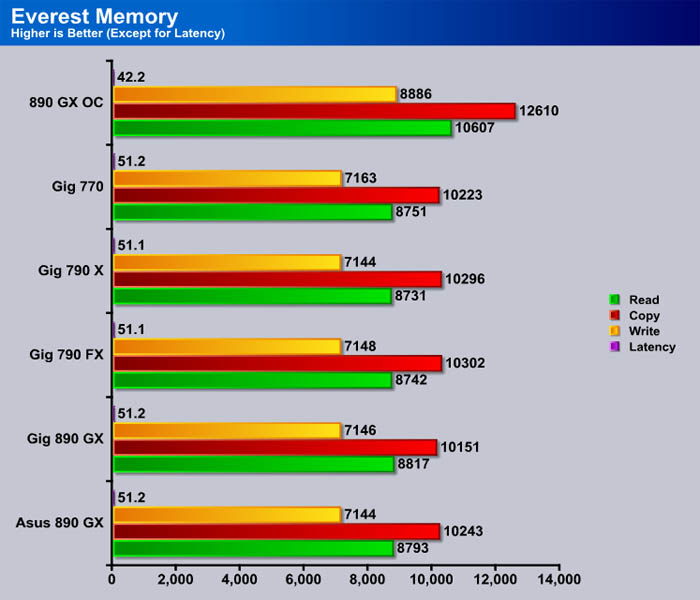
Since the RAM is running at the same speed for every setup except the overclocked CPU, the scores where similar. Anyone looking for a big improvement with the new chipset will be disappointed.
Cinebench

“CINEBENCH is a real-world test suite that assesses your computer’s performance capabilities. MAXON CINEBENCH is based on MAXON’s award-winning animation software, CINEMA 4D, which is used extensively by studios and production houses worldwide for 3D content creation. MAXON software has been used in blockbuster movies such as Spider-Man, Star Wars, The Chronicles of Narnia and many more. MAXON CINEBENCH runs several tests on your computer to measure the performance of the main processor and the graphics card under real world circumstances. The benchmark application makes use of up to 16 CPUs or CPU cores and is available for Windows (32-bit and 64-Bit) and Macintosh (PPC and Intel-based). The resulting values among different operating systems are 100% comparable and therefore very useful with regard to purchasing decision-making. It can also be used as a marketing tool for hardware vendors or simply to compare hardware among colleagues or friends.”
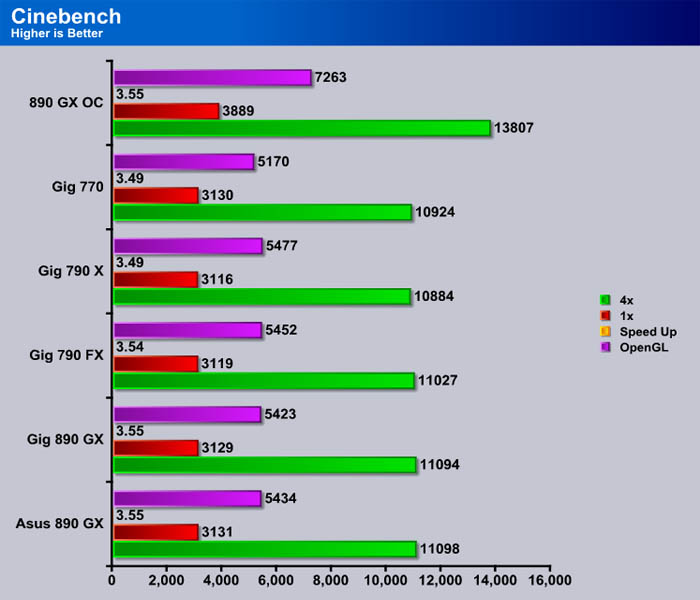
As with the other tests before this, the scores are very similar. When overclocked the 890 GX pulls ahead, but this is true with any chipset using an overclocked CPU.
WinRar v. 3.9

This module in WinRar generates random data, which contains specially introduced redundancy, increasing the load to both the processor and memory. Data is then passed through RAR compression and decompression algorithms, and the output of the decompression algorithm is compared to the source data. If any differences are found, WinRar then reports “Errors found – Yes” in the command window. WinRar displays a size of processed data and compression speed, current and resulting, in kilobytes per second.
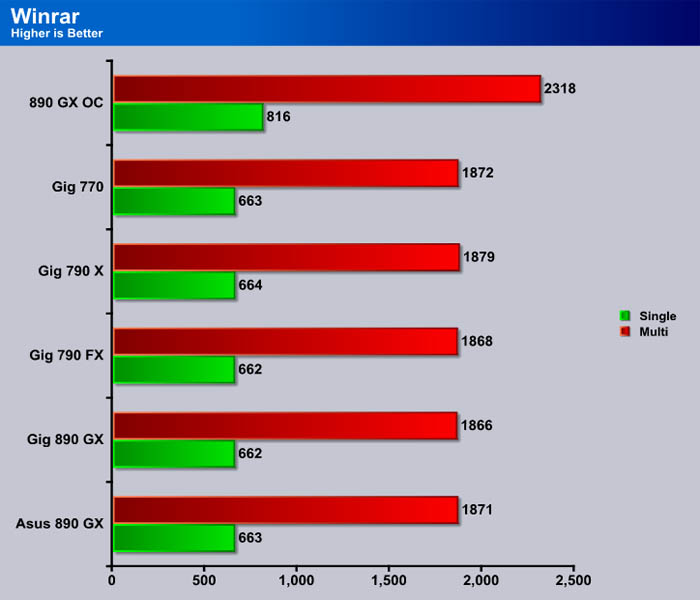
This is actually the closest the scores have come to each other. Nearly every board got the exact same score. Overclocking helped significantly, showing that the Athlon II scales quite well.
Sisoft Sandra
“SiSoftware Sandra (the System Analyser, Diagnostic and Reporting Assistant) is an information & diagnostic utility. It should provide most of the information (including undocumented) you need to know about your hardware, software and other devices whether hardware or software. It works along the lines of other Windows utilities, however it tries to go beyond them and show you more of what’s really going on. Giving the user the ability to draw comparisons at both a high and low-level. You can get information about the CPU, chipset, video adapter, ports, printers, sound card, memory, network, Windows internals, AGP, PCI, PCI-X, PCIe (PCI Express), database, USB, USB2, 1394/Firewire, etc.”
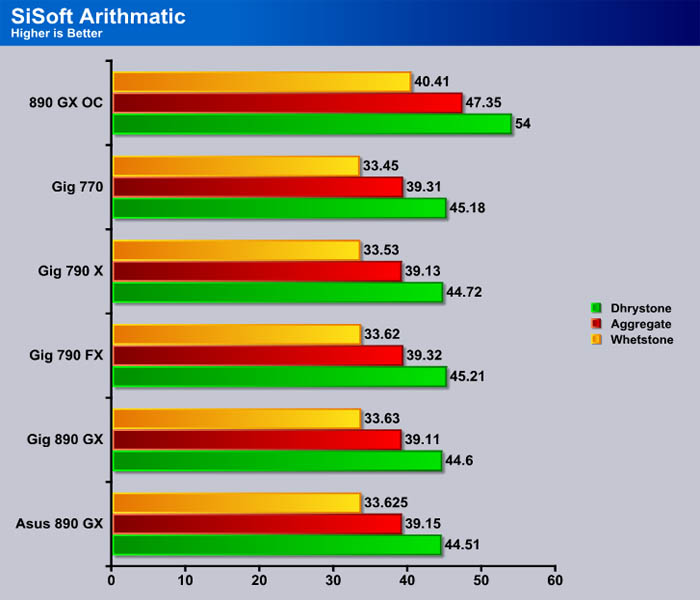
If you have been carefully reading the scores between the Gigabyte 890, and the Asus 890 you would notice that they trade the lead back and forth. This is pretty much to be expceted since there basicaly a carbon copy with a different heat sink slapped on.
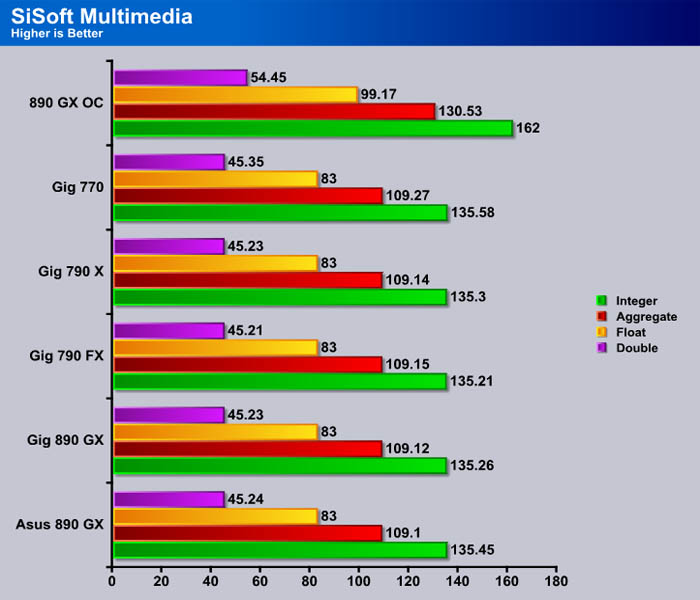
All of the stock clocked boards scored exactly 83 on the float test. This is a rare result, but since all of the other tests are so close this isn’t that big of a surprise.
POV-Ray 3.7 Beta 25

The Persistence of Vision Ray-Tracer was developed from DKBTrace 2.12 (written by David K. Buck and Aaron A. Collins) by a bunch of people (called the POV-Team) in their spare time. It is a high-quality, totally free tool for creating stunning three-dimensional graphics. It is available in official versions for Windows, Mac OS/Mac OS X and i86 Linux. The POV-Ray package includes detailed instructions on using the ray-tracer and creating scenes. Many stunning scenes are included with POV-Ray so you can start creating images immediately when you get the package. These scenes can be modified so you do not have to start from scratch. In addition to the pre-defined scenes, a large library of pre-defined shapes and materials is provided. You can include these shapes and materials in your own scenes by just including the library file name at the top of your scene file, and by using the shape or material name in your scene. Since this is free software feel free to download this version and try it out on your own.
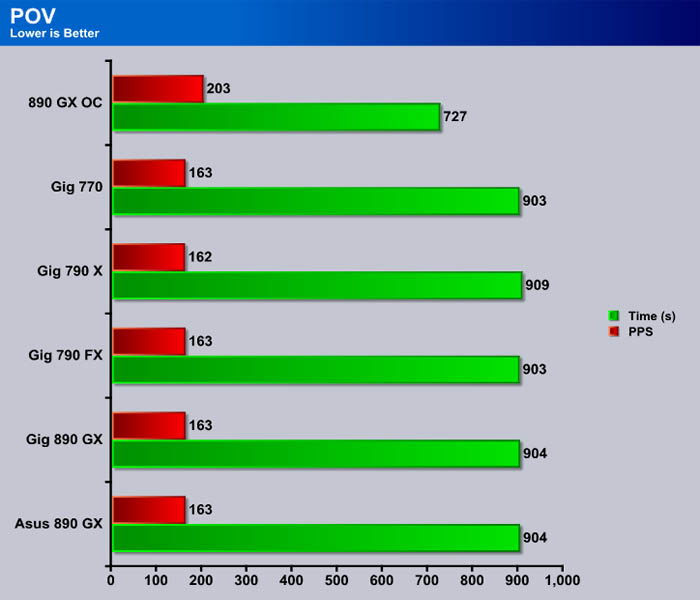
As with the Winrar test, we see almost the same exact scores. The overclocking takes a huge chunk out of the total time needed to render the scene.
Microsoft Excel 2007
Monte Carlo Black-Scholes Option Pricing Test
Microsoft Excel is the widely known and most used spreadsheet application for the manipulation and calculation for number crunching. With Excel you can analyze and share information on small scale or the largest scale you can imagine. We’ve seen spreadsheets in every day use that contain literally tens of thousands of numbers and hundreds of equations. Bjorn3D uses two tests in Excel to determine CPU and Motherboard performance.

Big Number Crunch
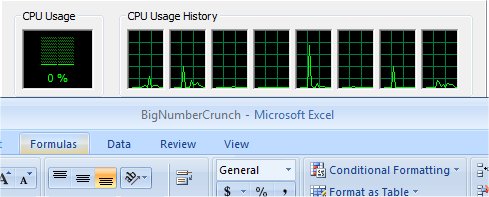
This workload is from a 6.2 MB spreadsheet and executes about 28,000 sets of calculations. It uses the most common calculations in Excel, addition, subtraction, division, rounding and Square Root. It also analyzes statistical functions such as Min, Max Median, and Average. The calculations are done after the spreadsheet with a large data set is updated with new values and must recalculate a large number of data points.
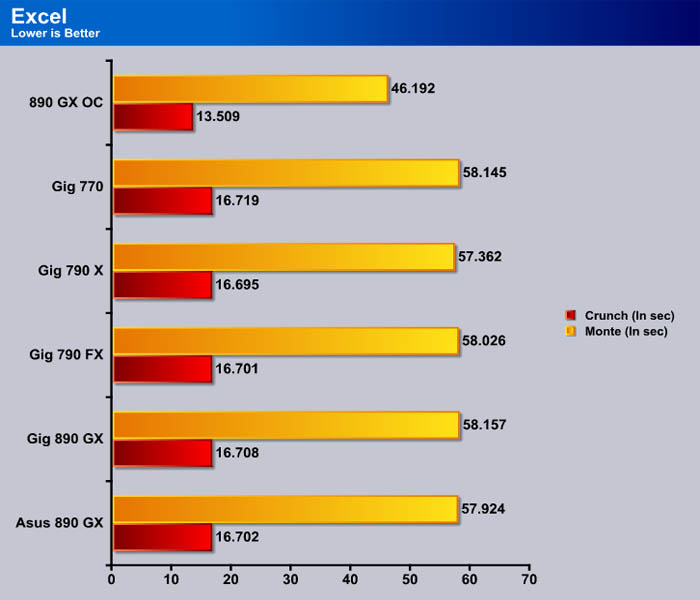
This is starting to become a little bit of a bore. With almost identical results it makes this testing almost useless. The overclocked board posted much better times (big surprise).
3DMark Vantage

For complete information on 3DMark Vantage Please follow this Link:
www.futuremark.com/benchmarks/3dmarkvantage/features/
The newest video benchmark from the gang at Futuremark. This utility is still a synthetic benchmark, but one that more closely reflects real world gaming performance. While it is not a perfect replacement for actual game benchmarks, it has its uses. We tested our cards at the ‘Performance’ setting.
Currently, there is a lot of controversy surrounding NVIDIA’s use of a PhysX driver for its 9800 GTX and GTX 200 series cards, thereby putting the ATI brand at a disadvantage. Whereby installing the PyhsX driver, 3DMark Vantage uses the GPU to perform PhysX calculations during a CPU test, and this is where things get a bit gray. If you look at the Driver Approval Policy for 3DMark Vantage it states; “Based on the specification and design of the CPU tests, GPU make, type or driver version may not have a significant effect on the results of either of the CPU tests as indicated in Section 7.3 of the 3DMark Vantage specification and white paper.” Did NVIDIA cheat by having the GPU handle the PhysX calculations or are they perfectly within their right since they own Ageia and all their IP? I think this point will quickly become moot once Futuremark releases an update to the test.
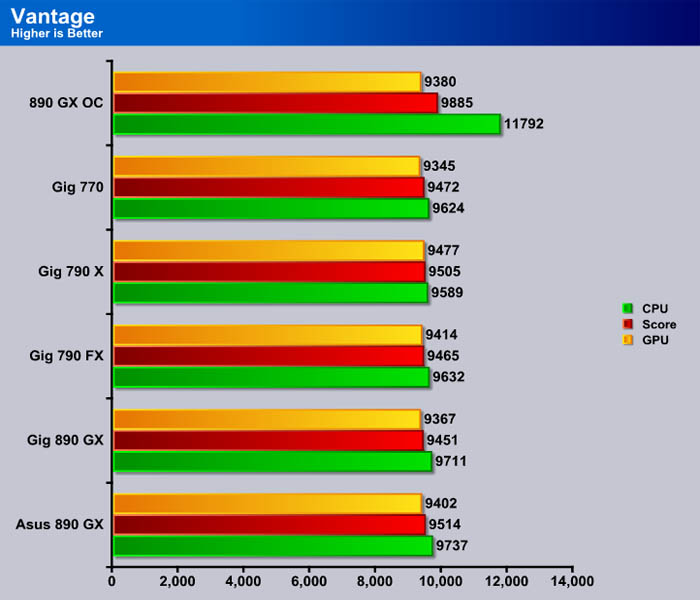
We see the GX boards getting a slightly higher CPU score in Vantage. The rest of the scores are about the same. We wanted to test out the 4290 graphics in Vantage, but it didn’t work at all. This is probably due to the beta Catalyst 10.3 drivers. With more mature drivers, the 4290 graphics should be a lot more agreeable.
Conclusion
The AMD 890 GX chipset put simply is a great addition to the already impressive AMD chipset line. It further improves the capabilities of the SB750 with a new version titled SB850. The SB 850 adds SATA 6Gb/s support, which is nice to see since almost every Intel board now includes this technology. This really shows that AMD is committed to enthusiasts even though they aren’t overpowering Intel’s i7, they still provide some of the best technologies to AMD users. We saw here today that the SB850 is not a huge leap in overclocking like the SB750 was, but was anyone truly expecting that much of a difference? If you where then you’ve probably come to the realization that the new SB hasn’t drastically increased overclocking potential.
While the new SB does not have official USB 3.0 support, expect to see just about every 890 GX come with USB 3.0. Many of the new 790 boards now are also adding this feature, but why invest in a 790 when the 890 is here? With the added features of the 890, there is no reason to grab a 790 unless you can get a deal on one for much cheaper than a 890. That brings us to the 890 GX’s price. According to AMD the Gigabyte test board will run between $130-180 USD, and the Asus will run between $130-160. Since this was written before its release its hard to pinpoint an exact price, but you can be this review will be updated once we have this information. As it stands now the 890 GX is looking like AMD kept the price to the bare minimum. Combine this with the latest technology, and you have a killer motherboard for a small price.
| OUR VERDICT: AMD 890 GX |
||||||||||||||||||
|
||||||||||||||||||
|
Summary: The AMD 890 GX simply put is a great improvement of the 790 series. This board adds native SATA 6Gb/s which is a must for many enthusiast as well as provideing more bandwidth than Intel’s offerings. |

| Motherboard Name | RAM | SB | USB | SATA | Socket | Price |
| Gigabyte GA-790FXTA-UD5 | DDR3 | 750 | 2 | 3 Gb/s | AM3 | $185 |
| MSI 790FX-GD70 | DDR3 | 750 | 2 | 3 Gb/s | AM3 | $168 |
| Gigabyte GA-790XTA-UD4 | DDR3 | 750 | 3 | 6 Gb/s | AM3 | $140 |
| MSI 790GX-G65 | DDR3 | 750 | 2 | 3 Gb/s | AM3 | $139 |
| Gigabyte GA-MA790XT-UD4P | DDR3 | 750 | 2 | 3 Gb/s | AM3 | $110 |
| ECS A790GXM-A | DDR2 | 750 | 2 | 3 Gb/s | AM2+ | $100 |
| Asus M4A78T-E | DDR3 | 750 | 2 | 3 Gb/s | AM3 | $128 |
| Asus M4A79T Deluxe | DDR3 | 750 | 2 | 3 Gb/s | AM3 | $179 |
| MSI K9A2 Platinum | DDR2 | 600 | 2 | 3 Gb/s | AM2+ | $126 |
| MSI K9A2 CF-F V2 | DDR2 | 600 | 2 | 3 Gb/s | AM2+ | $106 |