Power Consumption

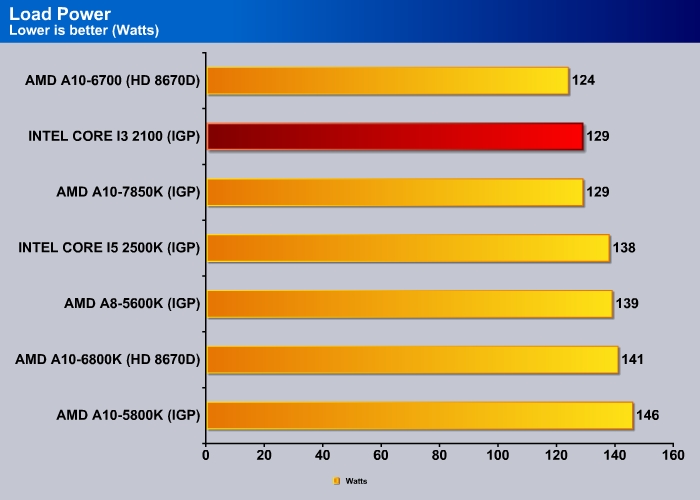
The idle power for the Kaveri is 46W, a little bit higher than the the A10-6800K but lower than the A10-5800K but they are essentially stayed the same. Under load, however, we see a big drop in the power consumption where the A10-7850K consumes 12 watts fewer than the A10-6800K. In fact, despite its 95W TDP, we see the A10-7850K consumes actually 83 watts more power under load compare to the idle.
One thing we did notice with the Kaveri is how the power is being distributed in the chip. In the past, when we stress both CPU and CPU, we saw both cores will run at the maximum frequency. However, it appears that Kaveri gives the GPU the priority when both CPU and GPU are stressed as we notice that the clockspeed on the CPU is reduced to 3.0 GHz while the GPU clockspeed remained 720MHz. Kaveri reserved about 30 watts of power to the GPU and the rest of the power is left for the CPU to use.
Configurable TDP: 45W, 65W, and 95W
Kaveri features configurable TDP where you would be able to lower the chip’s power consumption by reducing the clockspeed. As we mentioned earlier in the power consumption section, Kaveri seems to give preference to the GPU when is under load and this is the same when the TDP of the chip is altered. When we set the processor’s TDP to 45W, we noticed that the CPU often runs somewhere between 2.5GHz to 3.0GHz where 2.5GHz seems to be the base clock when all 4 cores are active and 3.0GHz is the Turbo clockspeed. At 65W, the CPU seems to run at 3.5GHz for most of the time regardless if it is lightly threaded or heavily threaded. We noticed that the GPU clockspeed does not seem to vary much where it runs at 720 MHz at any TDP.
We decided to run a few benchmarks to show the performance difference with the APU running at 45W, 65W, and 95W. The chart below gives us a sense just how much performance differences are there. We included the percentage of performance improvement compare against the 45W.
| Specifications | 45W | 65W | 95W |
| CPU Max Frequency (MHz) | 3.0 | 3.5 | 3.7 |
| Cinebench R15 CPU (single/multi) | 71/228 | 82/270 (15.19%/18.42%) | 93/318 (30.98%/39.47%) |
| Cinebench R15 (OpenGL) | 37.19 | 40.56 (9.06%) | 46.07 (23.87%) |
| 3DMark Fire Strike Overall | 1200 | 1303 (8.58%) | 1354 (12.83%) |
| 3DMark Fire Strike Graphics | 1305 | 1422 (8.97%) | 1473 (12.87%) |
| 3DMark Fire Strike Physics | 3042 | 3744 (23.08%) | 4469 (46.91%) |
| PCMark-Home | 3045 | 3232 (6.14%) | 3299 (8.34%) |
| x264-2 pass | 18.03 | 21.21 (17.64%) | 24.555 (35.91%) |
Looking at the performance scaling as we move from 45W to 65W and we can see that it delivers 6 to 20% improvement. The single thread and GPU performance seems to be about 10% improvement whereas the multi-thread performance shows a larger gain at around 20%. Moving up to 95W shows a similar trend though the improvement over the 65W TDP shows a smaller range from 2% to 17%.


With the new architecture, someone might get more perf gains from overclocking the memory and fsb before going after the multiplier.