The Sapphire HD 4870 redefines the on going battle between NVIDIA and ATI. The 4870 has leveled the playing field, is it time for little ATI payback?
INTRODUCTION
With the recent release of the new ATI 48XX GPU’s we’ve seen something that we haven’t seen for a while: Ati GPU’s in a direct head to head competition with the offerings from NVIDIA. Not only in a price for performance standpoint, like usual, but from a performance standpoint.
The ATI 4870 GPU has been putting out synthetic benchmark numbers that rival the GTX-260; up and coming 4870×2 offerings are sure to put the GTX-280 by the side of the road from a performance standpoint.
We are lucky enough to have a Sapphire HD 4870 on hand to test, and today we’re going to see if ATI has indeed managed to pull one out of the hat to level the playing field with the current offerings from NVIDIA.
About Sapphire
Welcome to the SAPPHIRE Family
Pioneers in a new era of how data is displayed and games are played, Sapphire shepherds the performance oriented with ground-breaking solutions to an environment that remains in a constant state of flux and ultimate evolution. For over ten years Sapphire has held true to its unwavering commitment, the commitment to deliver the most feature rich and soundly engineered products. Because of Sapphire’s firm position on achieving excellence with each product that leaves our ISO9001 and ISO14001 certified factories, you can rest assured that your customers will recognize YOUR commitment to selling only the highest of quality components.
Since ATI announced its manufacturing & distribution relationships with ODMs and AiBs in June of 2001, SAPPHIRE has been THE key ATI Graphics Boards Supplier worldwide and now stands poised and ready to capture the mainboard audience of those who seek a stable platform for their mission critical operations.
All SAPPHIRE ATI video boards are manufactured under 100% ATI production criteria including QC and outgoing system. Our monthly video board production capacity can reach a lofty 1.8 million and often topples this landmark figure. Our factory has always been the major manufacturer on ATI boards for most of the top ten tier 1 OEMs worldwide. With this background, you should undoubtedly be guaranteed of the impeccable quality, production capacity and product reliability of all ATI video boards and mainboards from SAPPHIRE. Be they business oriented or something just off center of the crosshairs, Sapphire has a solution for you and we look forward to an exciting and prosperous relationship with you!
SPECIFICATIONS & GPU COMPARISON TABLES
Specifications
| Sapphire 4870 and 4850 Specifications | ||
| GPU | HD 4850 | HD 4870 |
| GPU frequency | 625 MHz | 750 MHz |
| ALU frequency | 625 MHz | 750 MHz |
| Memory frequency | 993MHz | 900MHz |
| Memory bus width | 256 bits | 256 bits |
| Memory type | GDDR3 | GDDR5 |
| Memory quantity | 512 MB | 512 MB |
| Number of ALUs | 800 | 800 |
| Number of texture units | 40 | 40 |
| Number of ROPs | 16 | 16 |
| Shading power | 1 TFlop | 1.2 TFlops |
| Memory bandwidth | 31.78 GB/s | 115.2 GB/s |
| Number of transistors | 965 mil | 965 mil |
| Process | 55nm | 55nm |
| Die surface area | 260mm² | 260mm² |
| Generation | 2008 | 2008 |
| Shader Model supported | 4.1 | 4.1 |
We always like to put the advertised specifications against software reported specifications to check for the occasional honest typo.
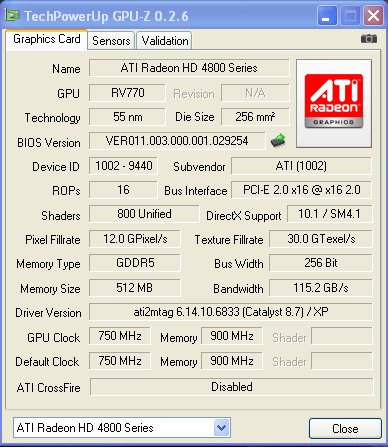
No surprises here, everything is just like advertised. We like to double check for software error, just in case.
Checked and double checked; it’s really a graphics card and every thing is just like it’s supposed to be.
GPU Comparison Table
Here’s a graphic that shows some of the differences between the hottest GPU’s out there today.
| Major GPU Specifications | |||||||
| GPU | HD 3870 X2 | 9800 GX2 | 8800 Ultra | GTX 260 | GTX 280 | HD 4850 | HD 4870 |
| GPU frequency | 825 MHz | 600 MHz | 612 MHz | 576 MHz | 602 MHz | 625 MHz | 750 MHz |
| ALU frequency | 825 MHz | 1500 MHz | 1512 MHz | 1242 MHz | 1296 MHz | 625 MHz | 750 MHz |
| Memory frequency | 900 MHz | 1000 MHz | 1080 MHz | 999 MHz | 1107 MHz | 993MHz | 900MHz |
| Memory bus width | 2×256 bits | 2×256 bits | 384 bits | 448 bits | 512 bits | 256 bits | 256 bits |
| Memory type | GDDR3 | GDDR3 | GDDR3 | GDDR3 | GDDR3 | GDDR3 | GDDR5 |
| Memory quantity | 2 x 512 MB | 2 x 512 MB | 768 MB | 896 MB | 1024 MB | 512 MB | 512 MB |
| Number of ALUs | 640 | 256 | 128 | 192 | 240 | 800 | 800 |
| Number of texture units | 32 | 128 | 32 | 64 | 80 | 40 | 40 |
| Number of ROPs | 32 | 32 | 24 | 28 | 32 | 16 | 16 |
| Shading power | 1 TFlop | 1152 GFlops | 581 GFlops | 715 GFlops | 933 GFlops | 1 TFlop | 1.2 TFlops |
| Memory bandwidth | 115.2 GB/s | 128 GB/s | 103.7 GB/s | 111.9 GB/s | 141.7 GB/s | 31.78 GB/s | 115.2 GB/s |
| Number of transistors | 1334 mil | 1010 mil | 754 mil | 1400 mil | 1400 mil | 965 mil | 965 mil |
| Process | 55nm | 65nm | 80nm | 65nm | 65nm | 55nm | 55nm |
| Die surface area | 2 x 196 mm² | 2 x 324 mm² | 484 mm² | 576 mm² | 576 mm² | 260mm² | 260mm² |
| Generation | 2008 | 2008 | 2007 | 2008 | 2008 | 2008 | 2008 |
| Shader Model supported | 4.0 | 4.0 | 4.0 | 4.0 | 4.0 | 4.1 | 4.1 |
FEATURES, PACKAGING & BUNDLE
Features
- TeraScale Graphics Engine
The powerful new TeraScale graphics engine features deliver high resolutions and fast frame rates. - Enhanced Anti-Aliasing & Anisotropic Filtering
High performance anisotropic filtering and 24x custom filter anti-aliasing (CFAA) smooth jagged edges and create true-to-life graphics, for everything from grass to facial features. - DirectX 10.1
Play today while preparing for tomorrow with state-of-the-art DirectX 10.1 graphics capabilities. - ATI CrossFireX™ Technology
ATI CrossFireX™ technology with up to quad GPU support offers superior scalability so your system is ready to level up when you are. - PCI Express 2.0
- Support for PCI Express 2.0
will prepare you for bandwidth-hungry games and 3D applications. - Power to Spare
This GPU has the brute processing power needed for physics, artificial intelligence, stream computing and ray tracing calculations. - Unified Video Decoder 2
Unified Video Decoder 2 frees up your CPU for other tasks so you get The Ultimate Visual Experience™ for even the most processing-intensive content, including VC-1, H.264 and now MPEG-2. Also, take full advantage of Blu-ray functionality with dual-stream, picture in picture (PIP) capabilities. - Upscale Beyond 1080p
Watch the hottest Blu-ray movies or other HD content at full 1080p display resolution and beyond. - On-chip HDCP
On-chip HDCP (High-Bandwidth Digital Content Protection) makes life easier by allowing you to playback HDCP protected content. - HDMI
Enjoy the latest audio technologies using HDMI with 7.1 digital surround sound support. Also, xvYCC support allows the user to enjoy a wider range of color when connected to a capable HDTV. - ATI PowerPlay™ Technology
ATI PowerPlay™ Technology delivers high performance when needed and conserves power when the demand on the graphics processor is low. - Energy Efficient Manufacturing Process
* Second generation 55nm chip uses the industry’s most energy efficient manufacturing process.
Packaging
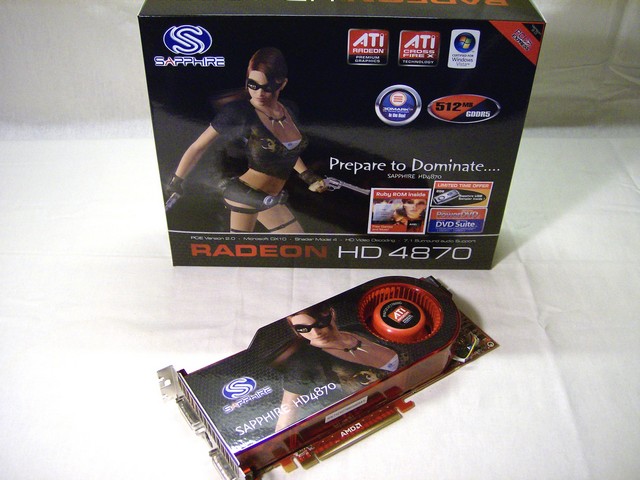
With the Sapphire HD 4870 calling our names we don’t want to spend a lot of time on the packaging. After all, it’s what’s in the package we are interested in.


The Sapphire HD 4870 comes in an attractive black box with a picture of Ruby on it. It has enough features and specifications on the box to help the consumer make an informed decision about purchasing it. The GPU is well packed and arrived safely despite the best efforts of the shipping company.
The Bundle
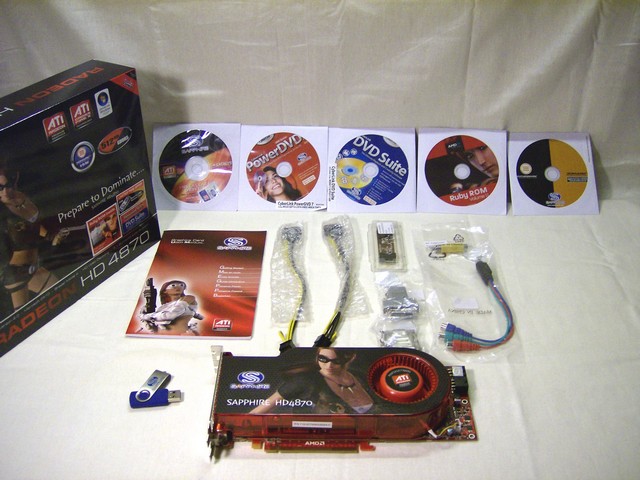
In the package with the Sapphire HD 4870 you’ll find:
- Package Contents
- 1 – Sapphire 4870 GPU
- 1 – Manual & Driver Disk
- 1 – Ruby Rom
- 1 – Power DVD
- 1 – DVD Suite
- 1 – 3DMark Vantage W/Key
- 1 – Sapphire Sampler 2 Gig Thumb Drive (limited Time Only)
- 1 – Crossfire Bridge
- 2 – Molex to PCI-E 6 pin adapters
- 1 – DVI to VGA Adapter
- 1 – DVI to HDMI Adapter
- 1 – Component Cable Adapter
- 1 – Svideo to Component Adapter
Quite a nice bundle for an ATI card, and while we would have liked to have seen a full version “Current” video game in the box, that would, of course, increase the cost. The inclusion of the 2 Gig thumb drive was a very welcome addition, as was 3DMark Vantage with an advanced license key valued at $19.95.
PICTURES & IMPRESSIONS
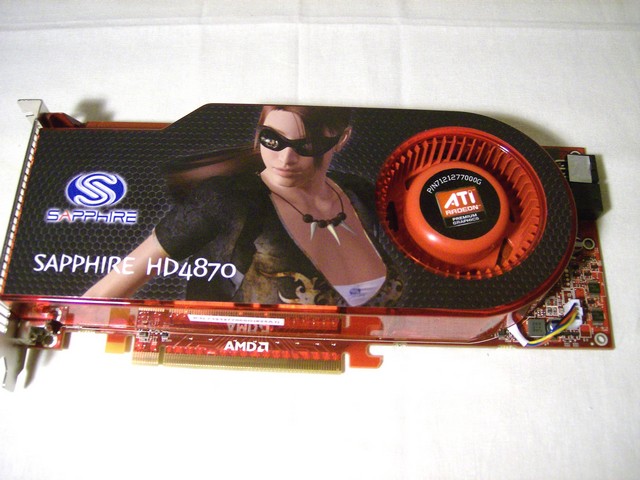
The Sapphire HD 4870 is a really nice looking card with a picture of Ruby, our favorite marketing character, on it. Before leaving for the night, we put the GPU in a locked case and when we returned in the morning we found a set of Geekish Lip prints on the glass of the case. How do we know they were “Geekish?” we found evidence of hotpocket crumbs by the case and a Xena DVD was left in the test rig drive.


We thought we’d throw a collection of angled shots out there, showing the Sapphire HD 4870 from every top angle, so you can get a good eye-full of this gaming power house. It’s kind of funny: no matter what angle you see Ruby from, she looks goooood.


The back of the GPU is unremarkable except for the presence of the backplate which is used to support the heat pipe arrangement under the cowling of the Sapphire HD 4870. In the second picture you can get a glimpse of the PCI-E 16X connector. Then the Dual slot design that’s become common on high end GPU’s to exhaust the heat out of the case. Then finally, the two 6 pin PCIE connectors that power the Sapphire HD 4870. You get a pretty decent look at the squirrel cage fan used to drive the heat off the toasty core and out the exhaust slot.
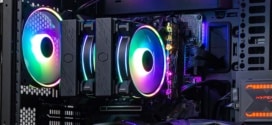
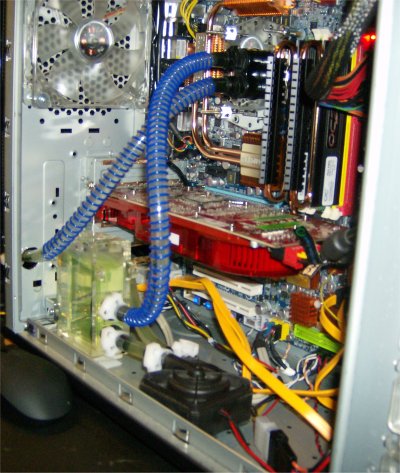
To give you a little of the drool factor, we’ll leave the pictures section with a shot of the Sapphire 4870 installed in the test rig. Please cover your keyboard with a towel and continue your drooling.
TESTING & METHODOLOGY
We’ll be doing the usual battery of tests on the Sapphire HD 4870, and comparing that with the Sapphire HD Toxic 4850 and a Leadtek GTX-260. All of our synthetic and gaming tests will be run at 1280 x 1024 and 1680 X 1050, with no Antialiasing or Anistropic Filtering, then with 4X Antialiasing and 16X Anistropic Filtering. Each of the tests will be run individually and in succession three times, and an average of the three results calculated and reported. F.E.A.R. benchmarks were also run with soft shadows disabled; all other games with every thing set to max. Crysis will be tested at 2xAA and 8xAF due to its demanding nature.
The Test Rig
| Test Rig “Quadzilla” |
|
| Case Type | Thermaltake Armor |
| CPU | Intel Q6600 @ 3.2 Voltage 1.3675 vcore |
| Motherboard | Gigabyte EP45-DQ6 |
| Ram | Patriot DDR2 1150 @ 5-5-5-15 2.1v |
| CPU Cooler | Swiftech MCP350 Pump Swiftech Apogee GT CPU Water Block Swiftech Micro Res Swiftech MCR320 360mm Radiator 3 Yate Loon 120mm 12v Fans 83CFM |
| Hard Drives | WD 160 Gig Sata 2 Model # WD1600AAJS Maxtor 160 Gig Sata 2 Model # 6G160E0 |
| Optical | Sony DVD R/W |
| GPU’s Tested | Sapphire HD 4870 @ 750/900 Drivers – Catalyst 8.7 Sapphire Toxic HD 4850 @ 675/1100 Drivers – Catalyst 8.7 Leadtek GTX-260 @ 576/999 Drivers XP 177.41 Drivers Vista 177.41 |
| Case Fans | Two 120mm Thermaltake Front/Rear Push/Pull 250mm Side fan 90mm Rear Exhaust 90mm Top Exhaus |
| Docking Stations | Tagan IB290 W/Deskstar 2 1/2 Inch 80 Gig Sata 2 Tagan IB390 W/Maxtor 160 Gig Sata 2 Thermaltake BlackX USB W/Seagate 80 Gig Sata 2 |
| Testing PSUs | Thermaltake Toughpower 1K Thermaltake VGA Express 650 Watt |
| Legacy | Floppy Drive |
| Mouse | Razer Lachesis |
| Keyboard | Razer Lycosa |
| Gaming Headset | Razer Piranha |
| Speakers | Logitec Dolby 5.1 |
| Any Attempt Copy This System Configuration May Lead to Bankrupcy | |
Synthetic Benchmarks & Games
| Synthetic Benchmarks & Games | |
| 3DMark06 v. 1.10 | |
| 3DMark Vantage | |
| PCMark Vantage | |
| Company of Heroes v. 1.71 DX 9 | |
| Crysis v. 1.2 DX 9 | |
| World in Conflict Demo DX 9 | |
| F.E.A.R. v 1.08 DX 9 | |
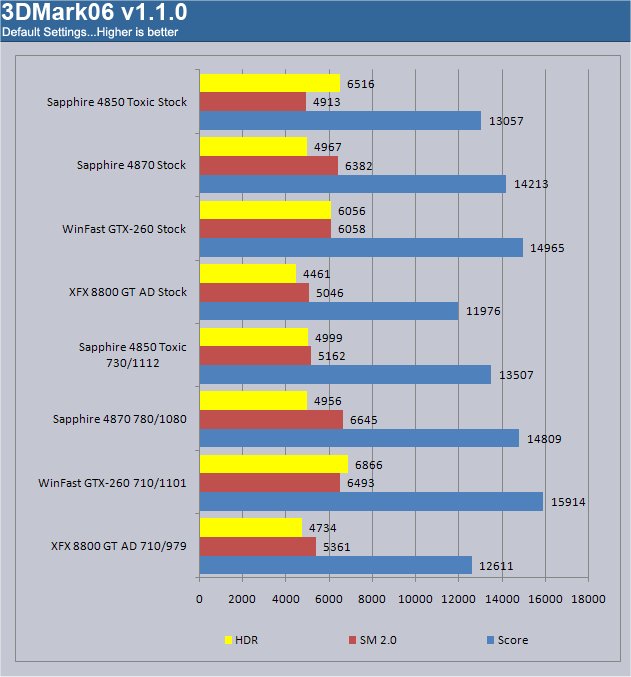
3DMARK06 V. 1.1.0

3DMark06 developed by Futuremark is a synthetic benchmark used for universal testing of all graphics solutions. 3DMark06 features HDR rendering, complex HDR post processing, dynamic soft shadows for all objects, water shader with HDR refraction, HDR reflection, depth fog and Gerstner wave functions, realistic sky model with cloud blending, and approximately 5.4 million triangles and 8.8 million vertices; to name just a few. The measurement unit “3DMark” is intended to give a normalized mean for comparing different GPU/VPUs. It has been accepted as both a standard and a mandatory benchmark throughout the gaming world for measuring performance.
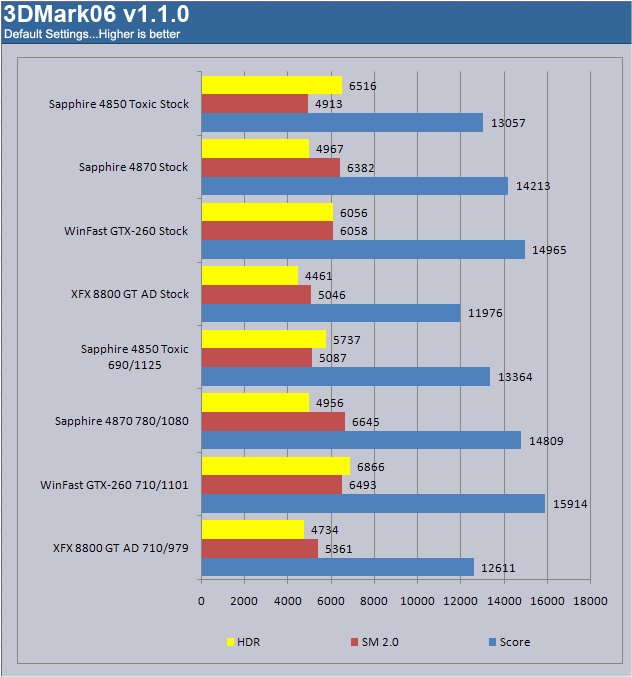
All of the tested GPU’s turned pretty good performances in 3DMarks06, but the GTX-260 took advantage with it’s better overclock ability. At stock, the 4870 was nipping at it’s heels, and the 4850 Toxic was nothing to sneeze at. It might come down to another price performance comparison with the performance being so close.
COMPANY OF HEROES V 1.71

Company of Heroes(COH) is a Real Time Strategy(RTS) game for the PC, announced on April, 2005. It is developed by the Canadian based company, Relic Entertainment, and published by THQ. COH is an excellent game that is incredibly demanding on system resources thus making it an excellent benchmark. Like F.E.A.R. the game contains an integrated performance test that can be run to determine your system’s performance based on the graphical options you have chosen. It uses the same multi-staged performance ratings as does the F.E.A.R. test. Letting the game’s benchmark handle the chore takes the human factor out of the equation, and ensures that each run of the test is exactly the same, producing more reliable results.
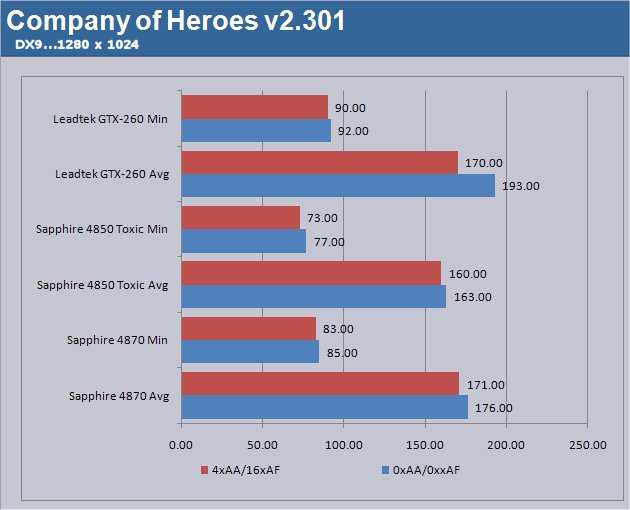
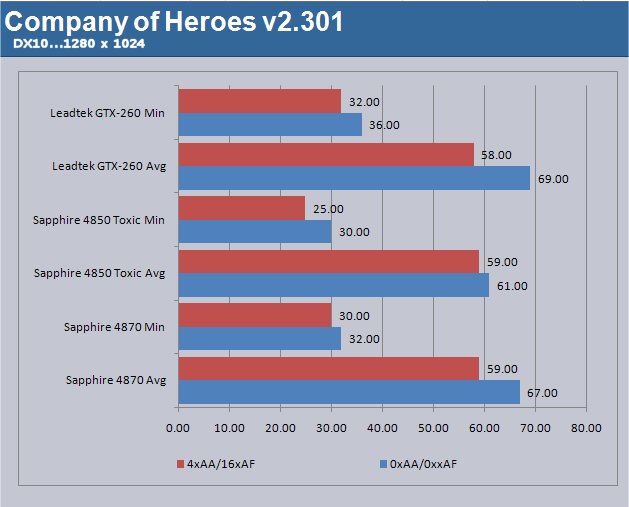
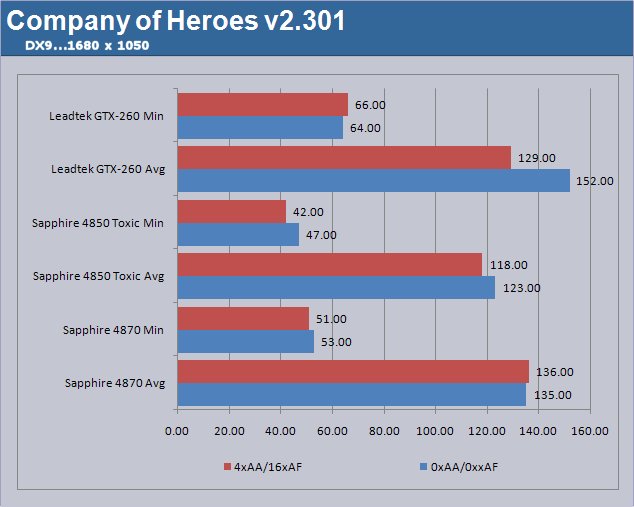
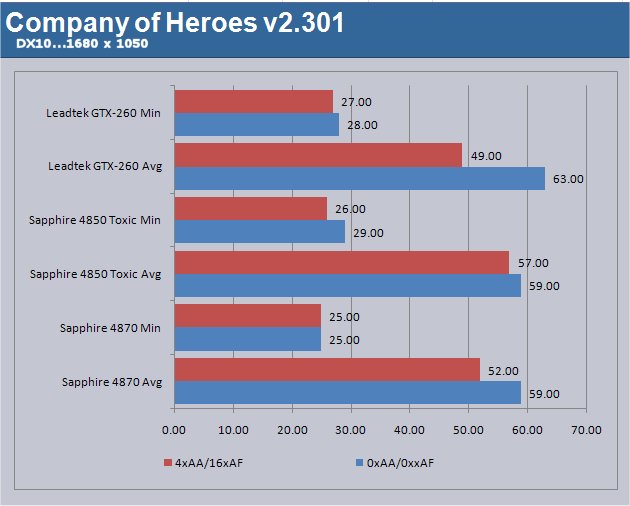
All of the GPU’s turned in respectable numbers in Company of Heroes. When we get to DX10 at 1680 x 1050 with AA/AF turned on they dipped a little bit – if it bothers you, try this little test: turn off AERO in Vista and run your own bench. We think you’ll be a little surprised.
FEAR V. 1.08
F.E.A.R. (First Encounter Assault Recon) is a first-person shooter game developed by Monolith Productions and released in October, 2005 for Windows. F.E.A.R. is one of the most resource intensive games in the FPS genre of games ever to be released. The game contains an integrated performance test that can be run to determine your system’s performance based on the graphical options you have chosen. The beauty of the performance test is that it gives maximum, average, and minimum frames per second rates. F.E.A.R. is a great benchmark, and one heck of a FPS.
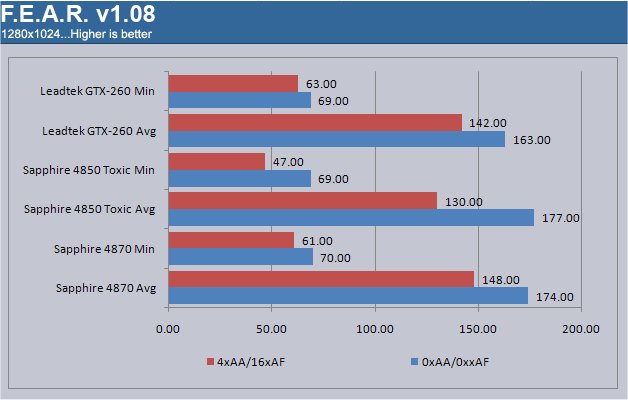
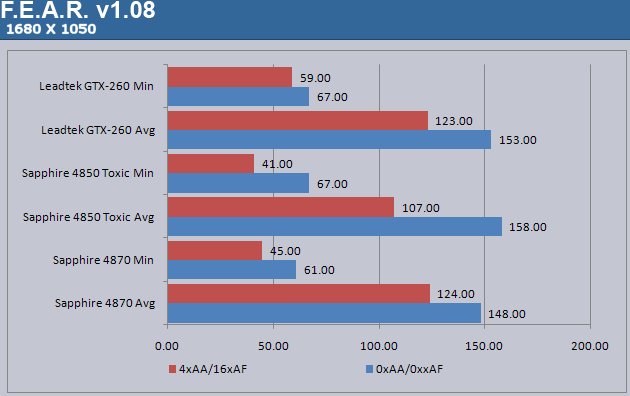
It’s really looking like this entire generation of GPU’s, both ATI and NVIDIA, are very capable graphics engines and price/performance is going to be the big issue. Unless you just have to have the fastest to enhance your E-Member self image.
WORLD IN CONFLICT DEMO

World in Conflict is a real-time tactical video game developed by the Swedish video game company Massive Entertainment, and published by Sierra Entertainment for Windows PC. The game was released in September of 2007
The game is set in 1989 during the social, political, and economic collapse of the Soviet Union. However, the title postulates an alternate history scenario where the Soviet Union pursued a course of war to remain in power.
World in Conflict has superb graphics, is extremely GPU intensive, and has built-in benchmarks. Sounds like benchmark material to us!
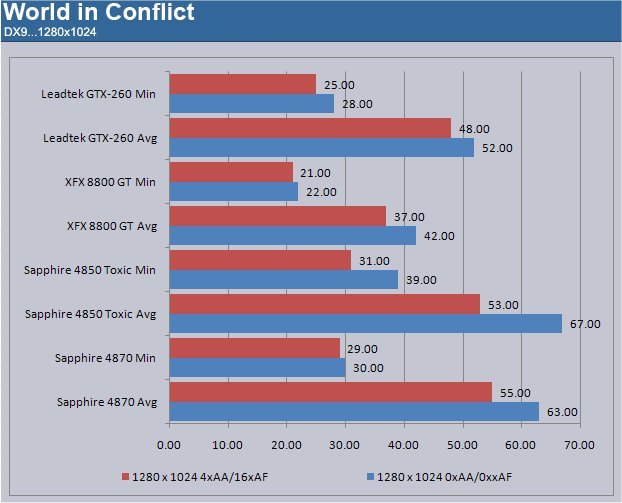
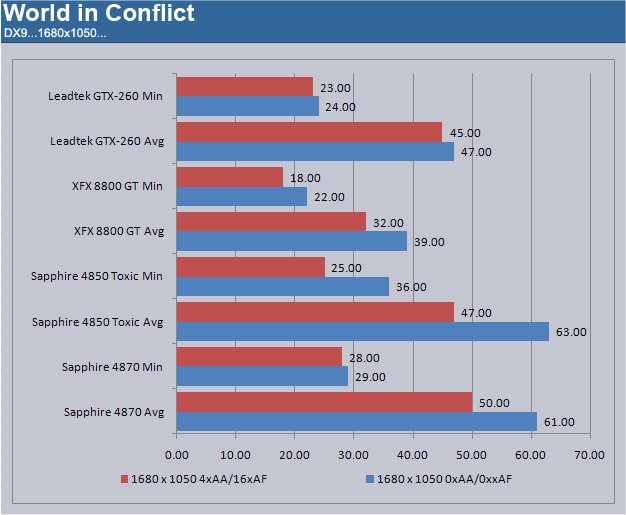
World In Conflict is liking the ATI action, and both the 4870 and 4850 Toxic did better than the GTX-260. We went in and played a little of the game on each GPU and found nothing in game play at any resolution or AA/AF setting to complain about. (Other than we’d like to have a little more play time.)
CRYSIS V. 1.2
Crysis is the most highly anticipated game to hit the market in the last several years. Crysis is based on the CryENGINE™ 2 developed by Crytek. The CryENGINE™ 2 offers real time editing, bump mapping, dynamic lights, network system, integrated physics system, shaders, shadows and a dynamic music system just to name a few of the state of-the-art features that are incorporated into Crysis. As one might expect with this number of features, the game is extremely demanding of system resources, especially the GPU. We expect Crysis to be a primary gaming benchmark for many years to come.
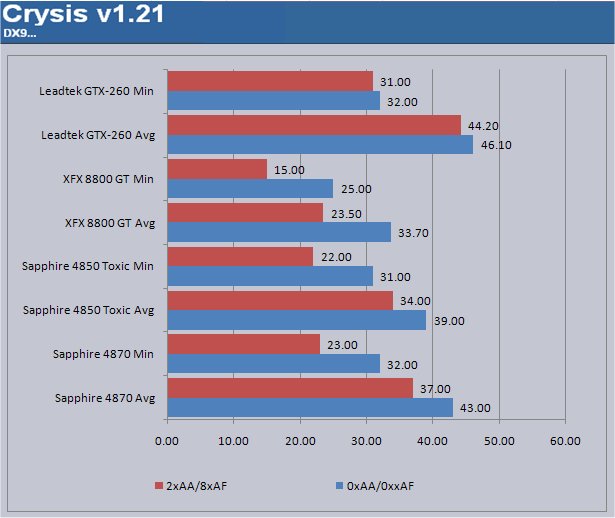
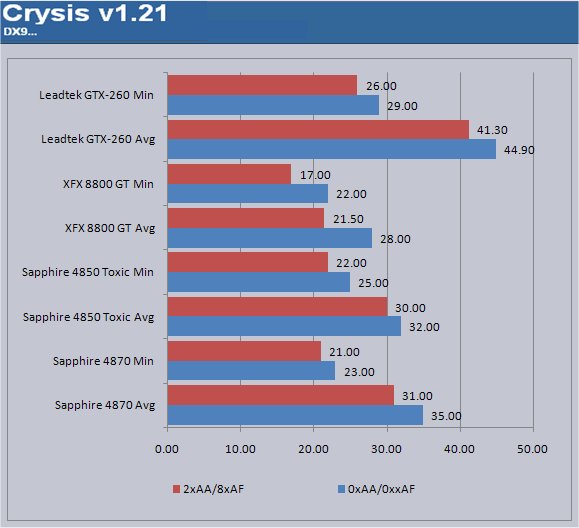
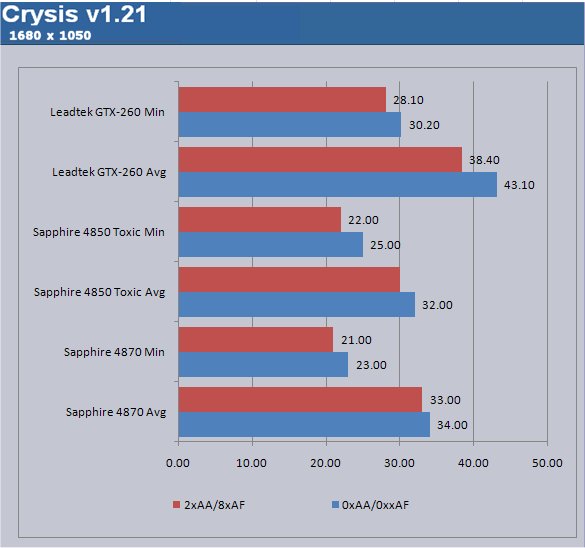
The GTX-260 turned in above 30 FPS at 1280 x 1024 with 0xAA/0xAF and every GPU dipped below that in the other tests. We hear rumors that in about 10 years GPU’s will be turning out good numbers in Crysis.
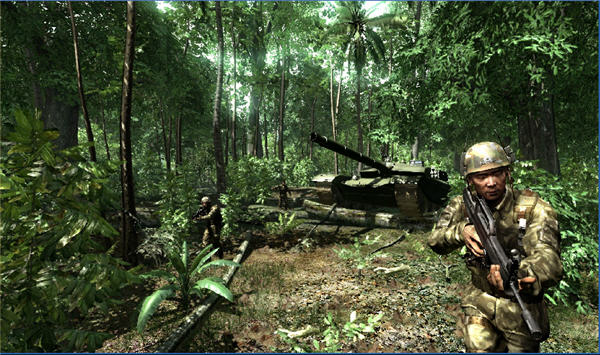
We were once again forced to load Crysis with each GPU installed and give it the Human test. That’s where we run and gun through the jungles with each GPU driving the game. We did this at 1680 x 1050 0xAA/0xAF for each GPU, and all of the tested GPU’s did well enough to satisfy our need for speed and graphics excellence. The testing results we reported were taken with the Crysis benchmark tool.
3DMARK VANTAGE & PCMARK VANTAGE
3DMark Vantage
The newest video benchmark from the gang at Futuremark. This utility is still a synthetic benchmark, but one that more closely reflects real world gaming performance. While it is not a perfect replacement for actual game benchmarks, it has its uses. We tested our cards at the ‘Performance’ setting.
Currently there is a lot of controversy surrounding NVIDIA’s use of a PhysX driver for its 9800 GTX and GTX 200 series cards there by putting the ATI 4850 Toxic and 4870 at a disadvantage. Whereby installing the PyhsX driver, 3DMark Vantage uses the GPU to perform PhysX calculations during a CPU test, and this is where things get a bit gray. If you look at the Driver Approval Policy for 3DMark Vantage it states “Based on the specification and design of the CPU tests, GPU make, type or driver version may not have a significant effect on the results of either of the CPU tests as indicated in Section 7.3 of the 3DMark Vantage specification and white paper.” Did NVIDIA cheat by having the GPU handle the PhysX calculations or are they perfectly within their right since they own Ageia and all their IP? I think this point will quickly become moot once Futuremark releases an update to the test. For now we will show the GPU and CPU score and let you judge.
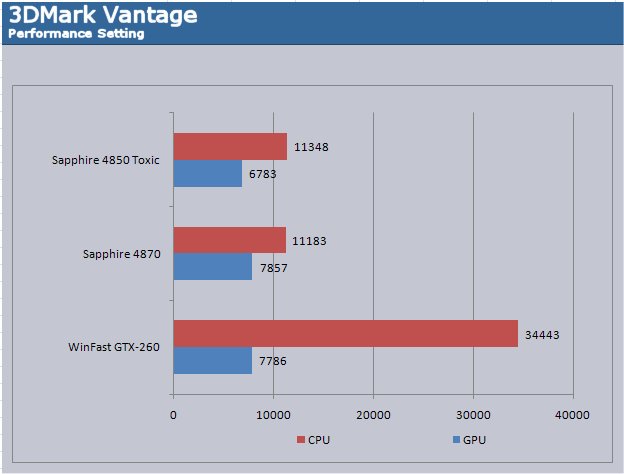
You can see the questionable increase in the CPU score from the use of PhysX; a person would think that if it were making that large a difference in the CPU score that we’d be seeing larger gains in gaming frame rates than we are. Future games that better support and utilize PhysX may tell the tale at a later date.
PCMark Vantage
PCMark® Vantage is the first objective hardware performance benchmark for PCs running 32 and 64 bit versions of Microsoft® Windows Vista®. PCMark Vantage is perfectly suited for benchmarking any type of Microsoft® Windows Vista PC from multimedia home entertainment systems and laptops to dedicated workstations and hi-end gaming rigs. Regardless of whether the benchmarker is an artist or an IT Professional, PCMark Vantage shows the user where their system soars or falls flat, and how to get the most performance possible out of his or her hardware. PCMark Vantage is easy enough for even the most casual enthusiast to use yet supports in-depth, professional industry grade testing.
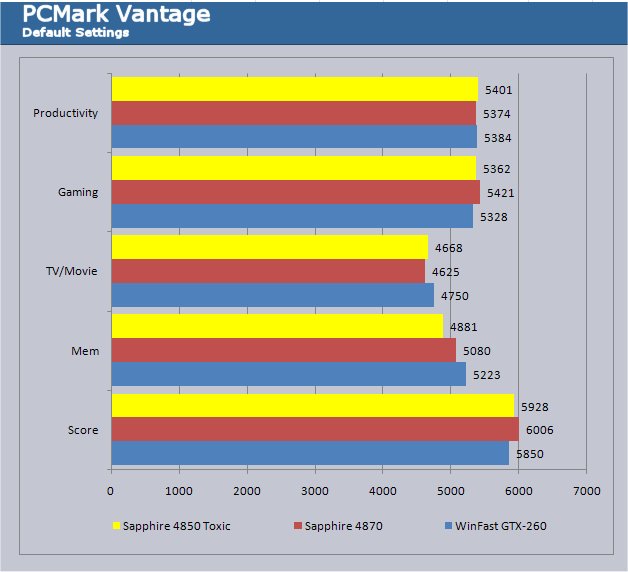
The 4850 Toxic and 4870 both gave better performances in the over all score in PCMark Vantage. They also did better in gaming, and the performance test numbers are just too close to make the call. All in all though, the tested GPU’s did well enough that the average user and most enthusiasts wouldn’t complain (unless they just like to whine, that is).
POWER CONSUMPTION, TEMPERATURES & OVERCLOCKING
Power Consumption
| GPU Power Consumption | |||
| GPU | Idle | Load | |
| Leadtek GTX-260 | 211 Watts | 299 Watts | |
| Sapphire Toxic HD 4850 | 183 Watts | 275 Watts | |
| Sapphire HD 4870 | 207 Watts | 298 Watts | |
| Total System Power Consumption | |||
Power consumption on the three tested GPU’s came in with the Sapphire HD Toxic 4850 consuming 183 – 275 watts Idle/Load 24 watts lower than the 4870 at idle and 23 watts lower at load. It was followed by the Sapphire 4870 which came in at 207 – 298 which was 4 watts lower at idle than the GTX-260, and 1 watt lower at load. These power consumption levels were taken with a Kill A Watt power meter and represent total power consumption for the whole system.
Temperatures
| GPU Temperatures | |||
| Idle | Load | ||
| Leadtek GTX-260 | 39C | 69C | |
| Sapphire Toxic HD 4850 | 45C | 67C | |
| Sapphire HD 4870 | 75C | 86C | |
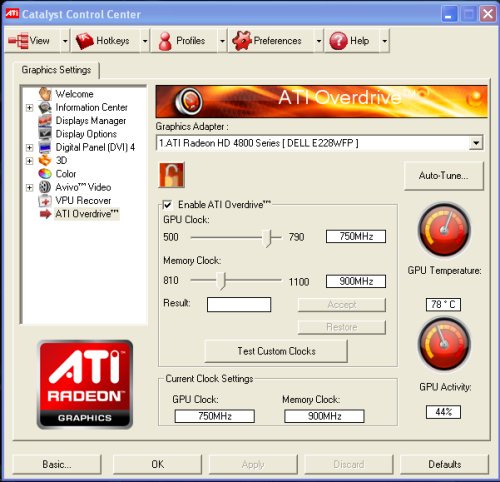
The Temperatures at idle were taken after 30 minutes at the desktop with nothing but essential background tasks running. Load temps were taken with 3DMarks06 looping for 30 minutes at a resolution of 1680 x 1050 and default settings. We took Idle temps at stock speeds, and it should be noted that the Idle temps – even at maximum OC – only varied from stock speeds by about 1C. We took the Load temps at maximum OC to get worst case temperatures. The most amazing result we got was the 77C idle on the 4870, yet at maximum OC it only increased to 85C, which is hot but within the thermal envelope for that GPU. We are waiting with bated breath for a better cooling solution for the HD 4870 because we think it’s got more to offer.
Overclocking
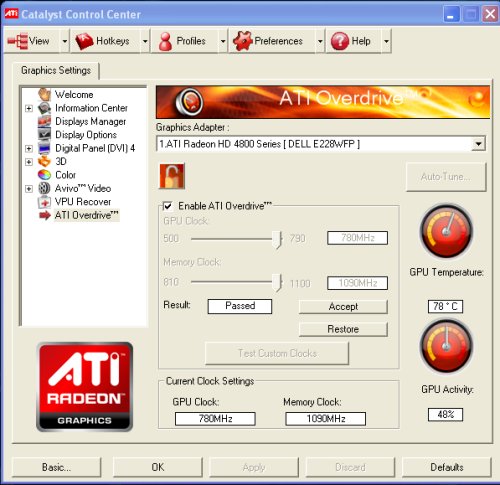
The best we could get from the Sapphire HD 4870 was 780/1090, and that was stable enough to bench. We had to lower the memory clock to 1080 to avoid the occasional artifact after long term testing. After about 4 hours gaming at 1090 we got a few artifacts.
| Maximum Stable Overclock | |||
| GPU | Stock Speed | OC Speed | 3DMark06 Score (Best OC) |
| Leadtek GTX-260 | 576/999 | 676/1101 | 15914 |
| Sapphire Toxic HD 4850 | 675/1100 | 730/1112 | 13057 |
| Sapphire HD 4870 | 750/900 | 780/1080 | 14809 |
We were able to get a little more out of the HD 4850 so we updated the 3DMarks06 chart.
With the Sapphire HD 4870 we were able to get a nice little boost of 30 Mhz on the core and 180 Mhz on the memory. We can’t help but think that the 4870 has more to give, but with it’s significant thermal foot print, better cooling is needed before pushing the core much higher.
CONCLUSION
While the GTX-260 turned better numbers in “Synthetic Benches” during gaming, we couldn’t tell the difference between it and the Saphire HD 4870. While the higher benchmark numbers are nice, the Sapphire HD 4870 made us just as happy as any of the other tested GPU’s in gaming and surfing. When it comes to graphics, Synthetics are good for comparison, but living and gaming with a GPU is really where you want satisfaction. We found that satisfaction with the Sapphire HD 4870.
NVIDIA has been slow to adopt DX 10.1 and you can’t get 7.1 surround support on any of their products, so ATI has some lead in the technology department there. NVIDIA has CUDA and PhysX on their side.
Performance wise, though, between SLI and Crossfire, the scaling that you get with Crossfire has been better. It runs on motherboards that are a lot less expensive than SLI boards, and is the better performer at a better price for multiple GPU setups.
We found the Sapphire HD 4870 running a little warm for our tastes, but we have no problems with the performance, which is undoubtedly enthusiast level. The GTX-280 has been spotted in the $420.00 range, and given the price difference between the GTX-280 and the Sapphire HD 4870, it’d be hard to justify the extra expenditure for the beefier card. With the difference between the GTX-260 and the 4870 being almost non-existent, that is a call you’ll have to make. Just the fact that NVIDIA had to drop prices so much to compete should tell you a lot. We don’t appreciate the obvious price gouging NVIDIA and their partners have held us hostage with for so long. We do appreciate the ongoing reasonable pricing from ATI, which earns them a lot of good will points with us.
We find ourselves in uncharted waters with the Sapphire HD 4870. Performance is close to the GTX-260, but so is the price. Crossfire is less expensive to run but still a greater expenditure than single GPU solutions.
Sapphire and ATI have managed to close a significant portion of the performance gap, and they’ve done it at a price that most enthusiasts will be glad to see.
Gaming was pleasurable and trouble-free on the Sapphire HD 4870, and ATI Overdrive made it easy to obtain a decent overclock. When we wanted more, AMD GPU Clock Tool gave us that. During overclocking the 4870 started at an idle of 77C but only increased to 85C, and nothing we could do to it would raise that even momentarily.
We can’t wait to get the Sapphire 4870 and 4850 Toxic in Crossfire and crank out some smokin scores. Yes, you can Crossfire the 4850 Toxic and 4870, and we are going to do just that. We are also going to Crossfire the 4850 Toxic with another 4850 Toxic and see just how Toxic it can get.
Pros:
+ Great performance
+ Over Clocking Ease
+ DX 10.1
+ Nice Bundle
+ Ease of Install
+ Crossfire Ready
+ Good Power Consumption
+ Well Behaved
+ Competitive With Competitors Offerings
+ Sweet Thumb Drive Included
+ Price
+ Quality Construction
Cons:
– Runs Hot
– No Game in Bundle
– Ruby Didn’t Show Up In Person
The Sapphire 4870 has redefined the playing field in current GPU offerings. It turned in great numbers and provided unparalleled eye popping graphics that could only be dreamed of a few short years ago.
Final Score of 8.5 out of 10 and the Bjorn3D Seal of Approval.