Testing & Methodology
We’ve expanded our testing suite considerably since the X79 chipset release, and will continue to use the same methods for most of the motherboards and CPU’s we test. In the interests of thoroughness and accurate results, we run each test at least three times, and some tests more than that. We average the total of all the tests from each benchmark then report the average here.
The OS we use is Windows 7 Pro 64bit with all patches and updates applied. We also use the latest drivers available for the motherboard and any devices attached to the computer. We do not disable background tasks or tweak the OS or system in any way. We turn off drive indexing and daily defragging. We also turn off Prefetch and Superfetch. This is not an attempt to produce bigger benchmark numbers. Drive indexing and defragging can interfere with testing and produce confusing numbers. If a test were to be run while a drive was being indexed or defragged, and then the same test was later run when these processes were off, the two results would be contradictory and erroneous. As we cannot control when defragging and indexing occur precisely enough to guarantee that they won’t interfere with testing, we opt to disable the features entirely.
Prefetch tries to predict what users will load the next time they boot the machine by caching the relevant files and storing them for later use. We want to learn how the program runs without any of the files being cached, and we disable it so that each test run we do not have to clear pre-fetch to get accurate numbers. Lastly we disable Superfetch. Superfetch loads often-used programs into the memory. It is one of the reasons that Windows occupies so much memory. Vista fills the memory in an attempt to predict what users will load. Having one test run with files cached, and another test run with the files un-cached would result in inaccurate numbers. Again, since we can’t control its timings so precisely, it we turn it off. Because these four features can potentially interfere with benchmarking, and are out of our control, we disable them. We do not disable anything else.
One thing to note is that we are revamping our testing method in order to better represent motherboard performance and offering to you guys the consumer. Also we want to make it an easier read for you without miles of endless charts. Please feel free to provide feedback on what you think as many benchmarks will be shuffled or removed completely.
Test Rig
| Test Rig | |
| Case | Open Test Bench |
| CPUs |
|
| Motherboards |
|
| Ram | Corsair Vengeance DDR4 2666 16GB GSkill TridentX 2666MHz |
| CPU Cooler |
|
| Hard Drives | Western Digital Velociraptor 1TB 10000RPM 6Gb/s Hard Drive |
| SSD | 1x Plextor M.2 M6E 512GB SSD (X99) 1x Kingston HyperX 240GB SATA III 6Gb/s SSD (non X99) |
| Optical | ASUS DVD-Burner |
| GPU | Nvidia GTX 780 |
| PSU | Thermaltake Toughpower XT 1475W Gold |
| Mouse | Tt eSPORTS Black Gaming Mouse |
| Keyboard | Tt eSPORTS Meka G1 Mechanical Gaming Keyboard |
Test Suite
We will use the following applications to test the performance of the Motherboard, Processor
| Benchmarks |
|---|
| SuperPi Mod 1.5 |
| Wprime 1.55 |
| PCMark 7 |
| 3DMark 11 |
| Cinebench R11.5 |
| X264HD |
| Truecrypt 7.1 |
| Unigine Heaven 4.0 |
| Metro 2033 |
| Batman Arkham City |
| Sniper Elite V2 |
| Handbrake |
| AIDA64 |
Overclocking

For overclocking I only had one sample this go around and I had a kind of pre warning from ASUS that the common clock is between 4.4-4.6 on air/water on these chips with some exceptional samples pulling 4.7GHz capable without going extreme cooling.
The chip I recieved has been a solid 4.5 or average performer and even at much more voltage has been mediocre results so in order to keep solid repeatable testing we stick at the 4.5GHz wall for overclock testing.
| CPU Frequency | Voltage Required (Load) |
| 3.0GHz (Stock) | 1.194V |
| 4.3GHz | 1.23V |
| 4.4GHz | 1.24V |
| 4.5GHz | 1.305V |
| 4.6GHz | FAIL |
Here you can see a breakdown of the voltages applied to reach the target speed, but do note that I cannot verify if the voltages will match every CPU only time will tell how well each chip scales with settings but if history has taught us anything its that CPUs can vary by alot so dont expect to just plug in my exact setting and run well, but maybe this will help give you a baseline to start from.
One thing worth noting here is that the WS board was able to clock stock and up to 4.3GHz with less voltage than any board I have tested to date but after that it leveled with the rest and at 4.5GHz required a very minute amount more to be stable. I was actually concerned that maybe some degradation due to extended testing periods may have damaged the chip but swapping back to another board confirmed that the previous voltages still applied as normal with them. The difference is minute but still measurable via DVOM.
Important note: Overclocking can cause component failure. Please exercise caution when attempting any level of overclock on system components.
Temperatures

The temperatures were recorded with RealTemp while running wPrime 1024 right before the end of the 5th run. The results were recorded carefully. After the results were recorded, we waited for 30 minutes before taking Idle temperature measurements. The results were as follows:
| CPU Temperatures | Temperature (Idle/Load) |
| ASUS X99-E WS OC (4.5GHz) | 30C/64C |
| ASUS X99-E WS | 29C/49C |
| Chipset Temperatures | Temperature (Idle/Load) |
| ASUS X99-E WS OC (4.5GHz) | 29C/37C |
| ASUS X99-E WS | 27C/32C |
The Water 3.0 ultimate with it large surface area 360mm radiator keeps the CPU plenty cool.
PCmark 7

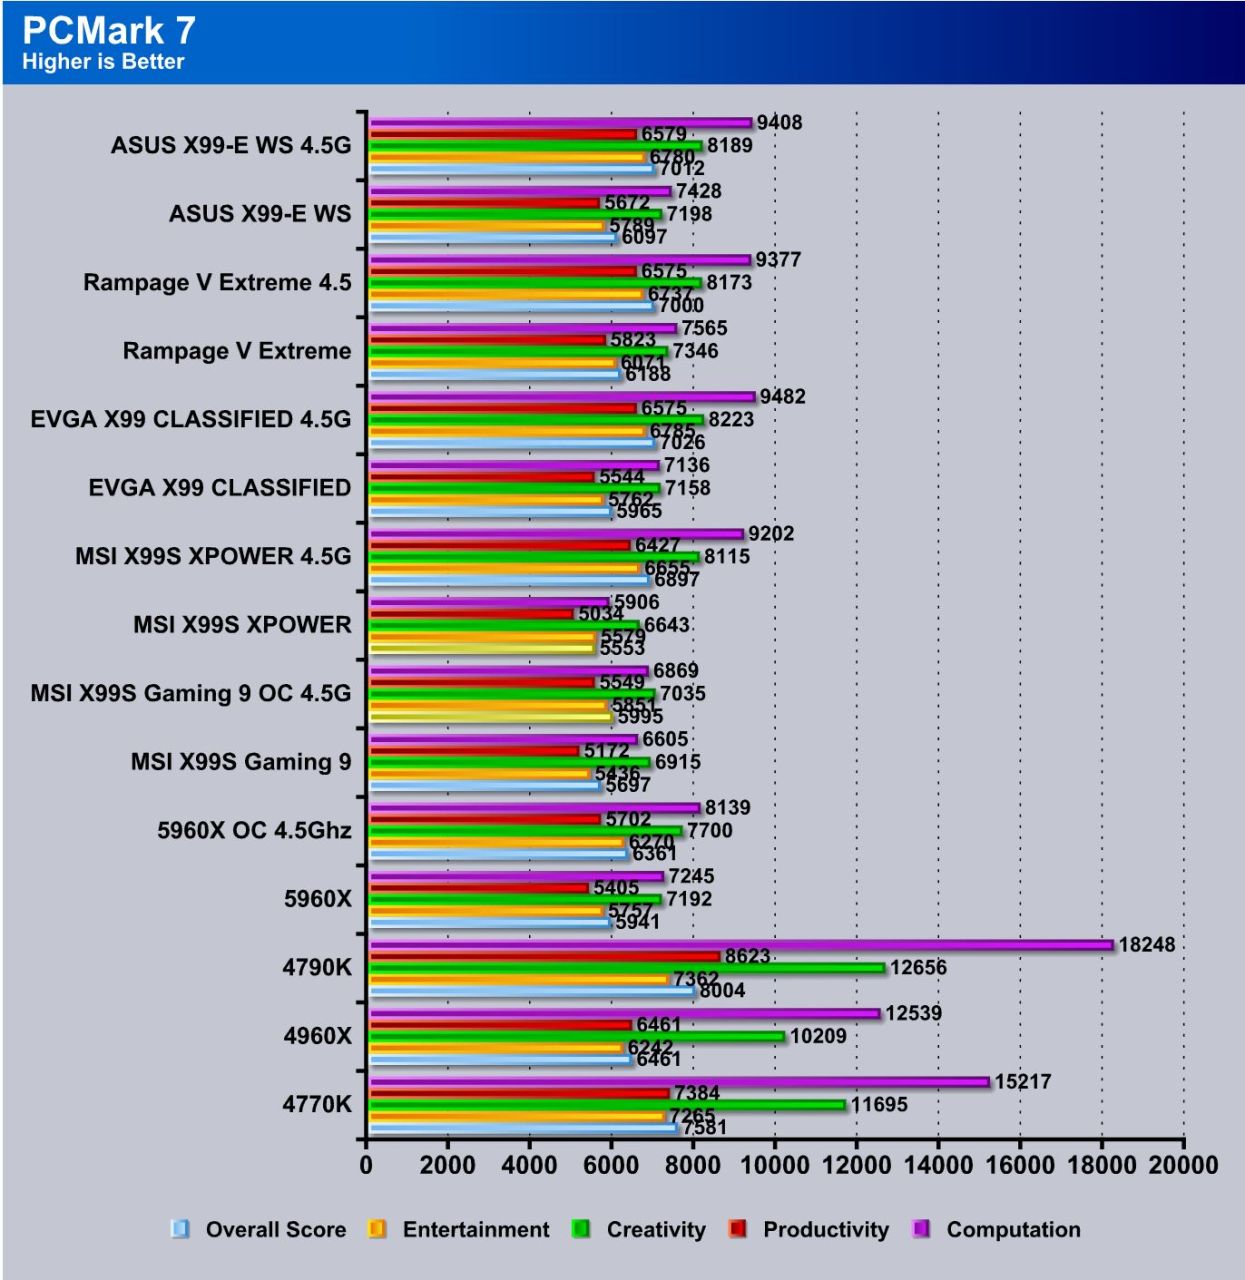
Here you can see the WS holds its own compared to even the high end Rampage board trading blows with the biggest and best in the game.
AIDA64
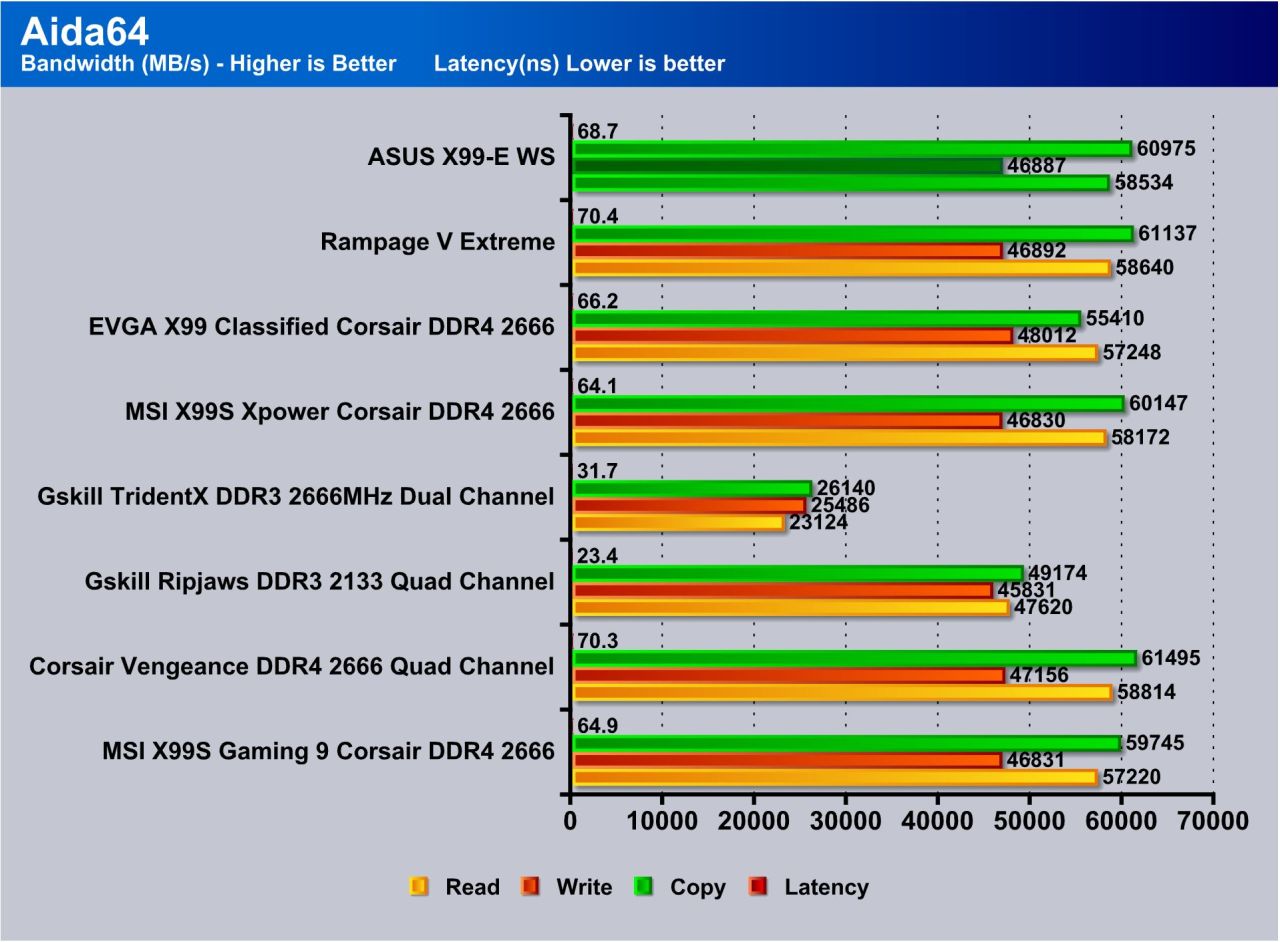
AIDA64 simply tests the memory and gives you raw input on performance for the memory bus and installed DIMMS. as you can see the new X99 platform with DDR4 can pull some massive bandwidth numbers but I was also a little shocked as to the high 70ns latency result. but it is worth noting that AIDA is getting constant updates and the bench as it stands takes up to a minute just to start so it is possible that once the software side is fixed this could be better.
Handbrake
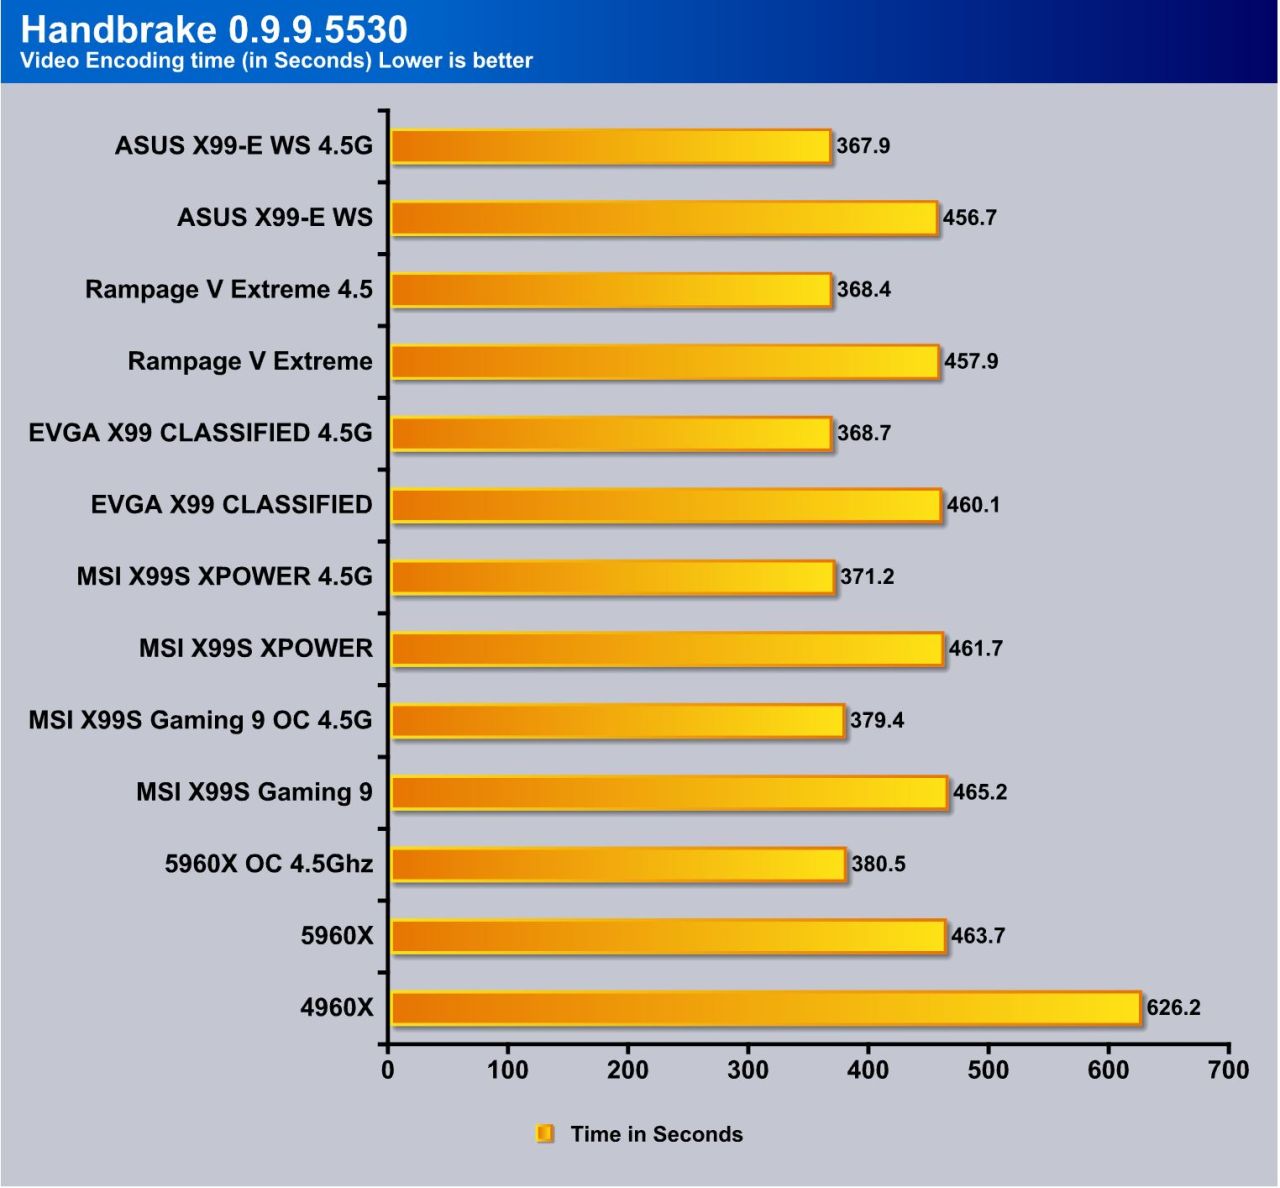
Handbrake is a free program used for transcoding video files. For this we used a 4K video file and ran it down to 1080 while manually keeping count of the time it took to process this via the CPU. as you can see when compared to the 4960X the new 5960X jumps far ahead and even almost halves the time once overclocked. Do note that the extra 4 threads will definitely help with this as the program utilizes all cpu threads when running the encoding operation.
3DMark 11
![]()
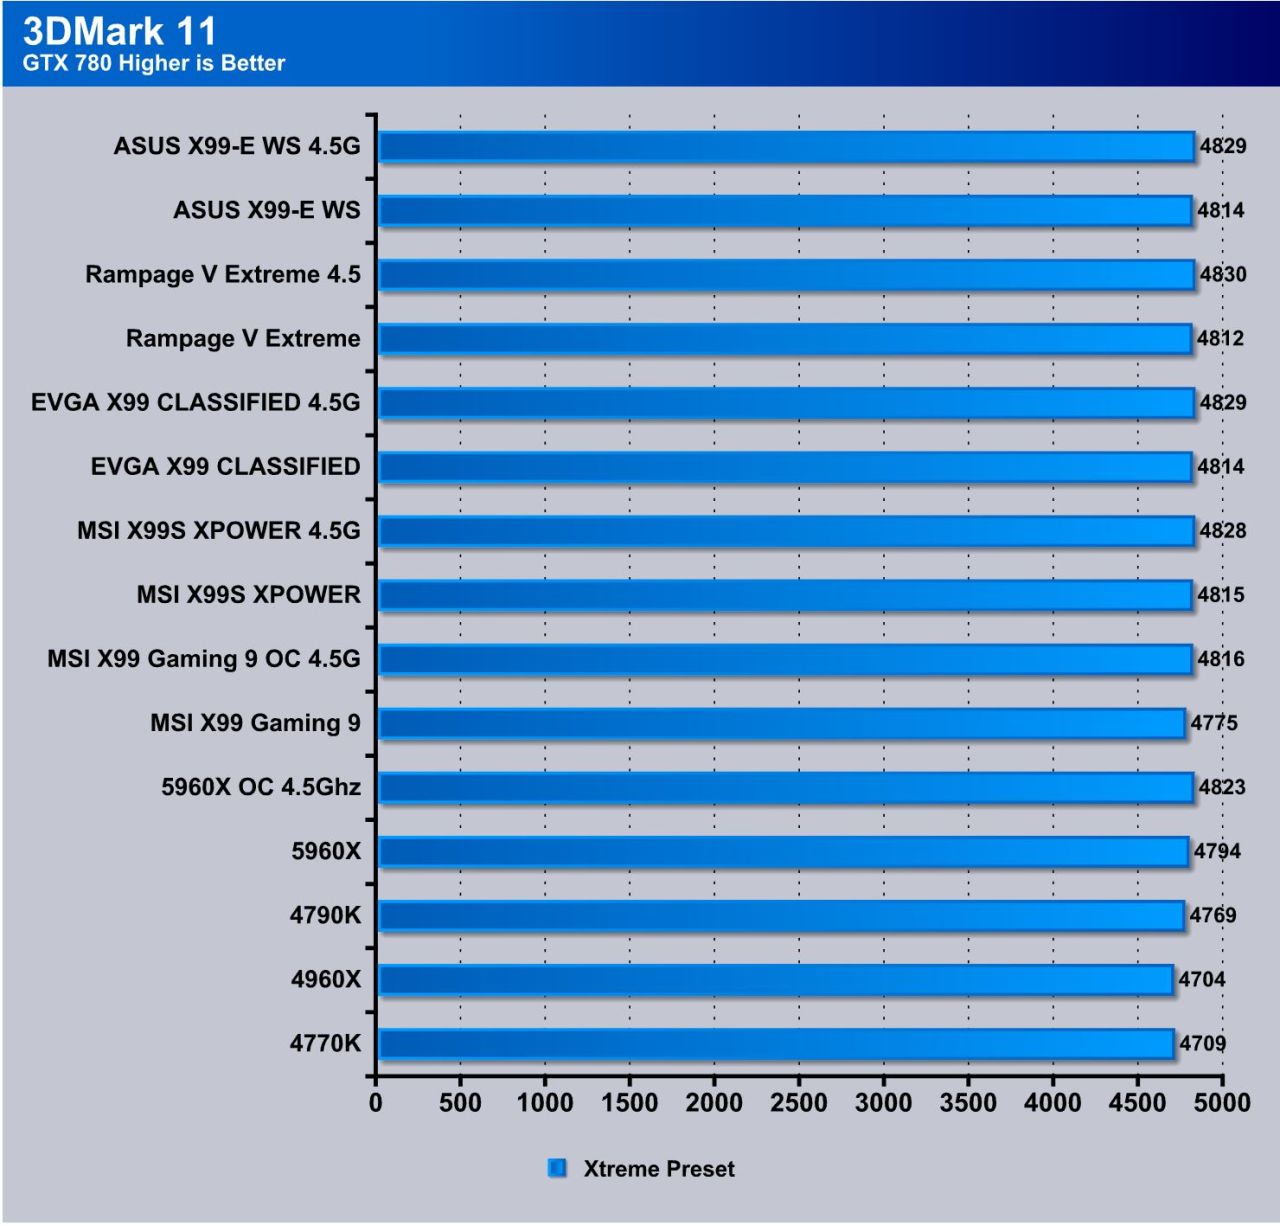
3DMark 11 shows once again that the WS falls right in line with the other X99 boards even though it is a Workstation/Server class board at heart.
SuperPi

This tests single threaded performance and clock efficiency by processing digits of the number pi. Here you can see that the newer boards and BIOS have really helped efficiency and the scores have made massive leaps in performance.
Wprime
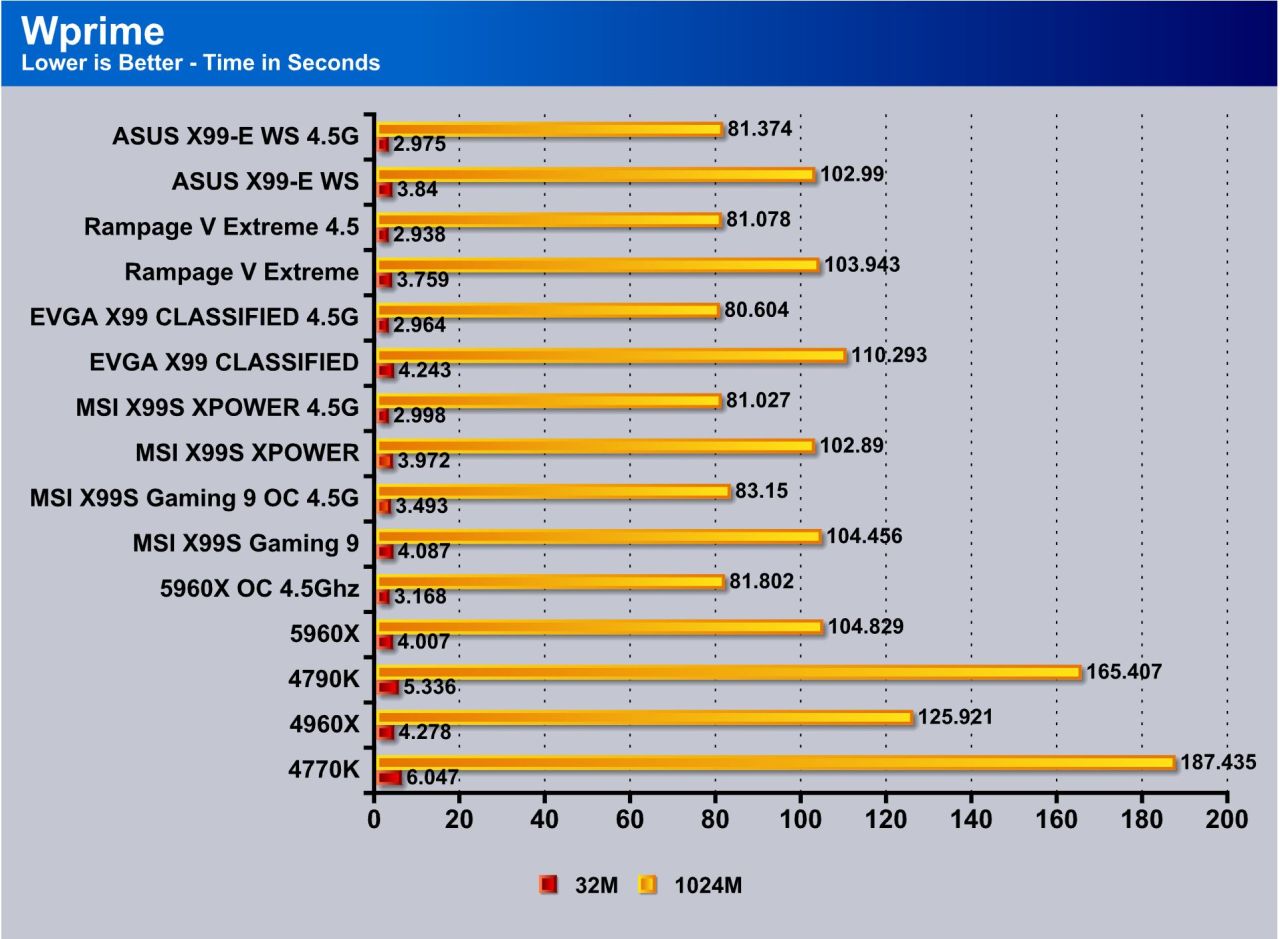
WPrime is similar to Superpi, but is multi core aware and you can set the core count. The 5960X with its 16 processing threads makes easy work of Wprime and gets us into the 2 second range at overclocked settings.
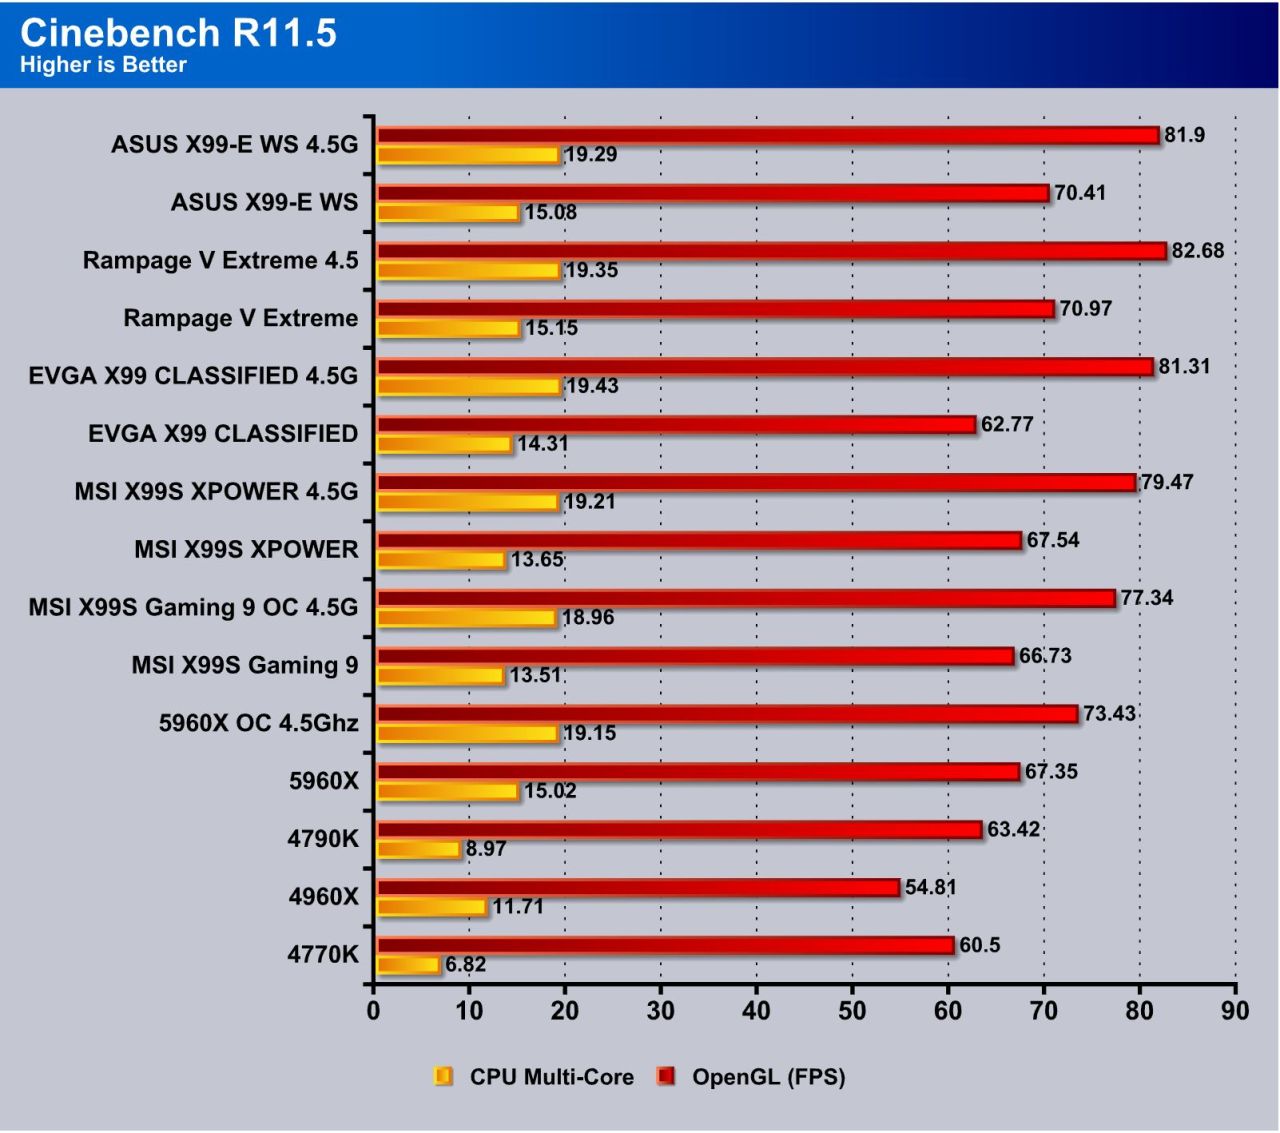
Cinebench R11.5
X264HD

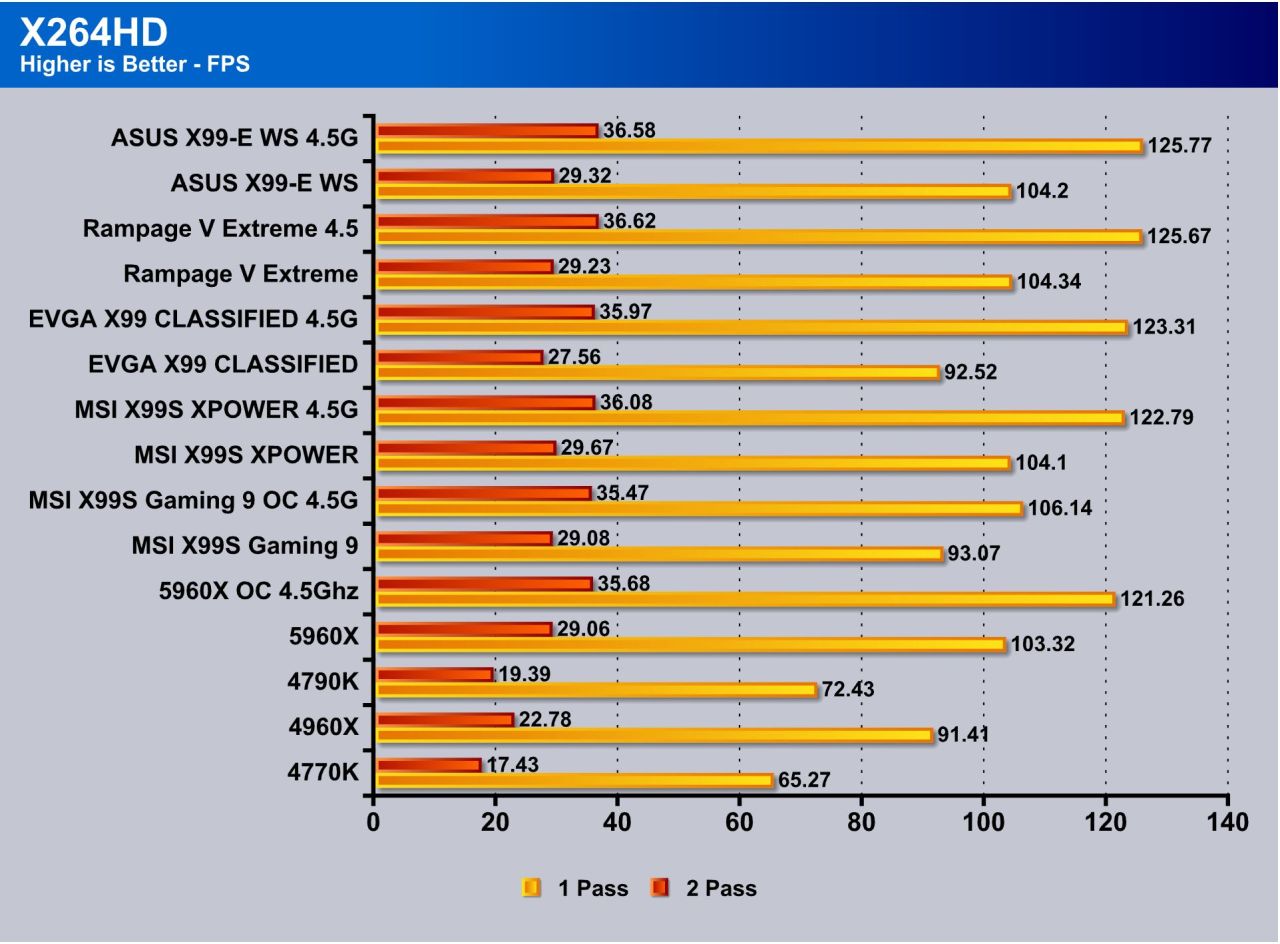
Transcoding has become more popular now and the latest Sandy Bridge and on processors added support for AVX instruction for faster video transcoding. Here again the 5960X is proving itself to be a work horse in these heavy laoded tasks as it chews thru them and gives scores higher than we have seen come through our test bench for any consumer part to date.
Truecrypt 7.1

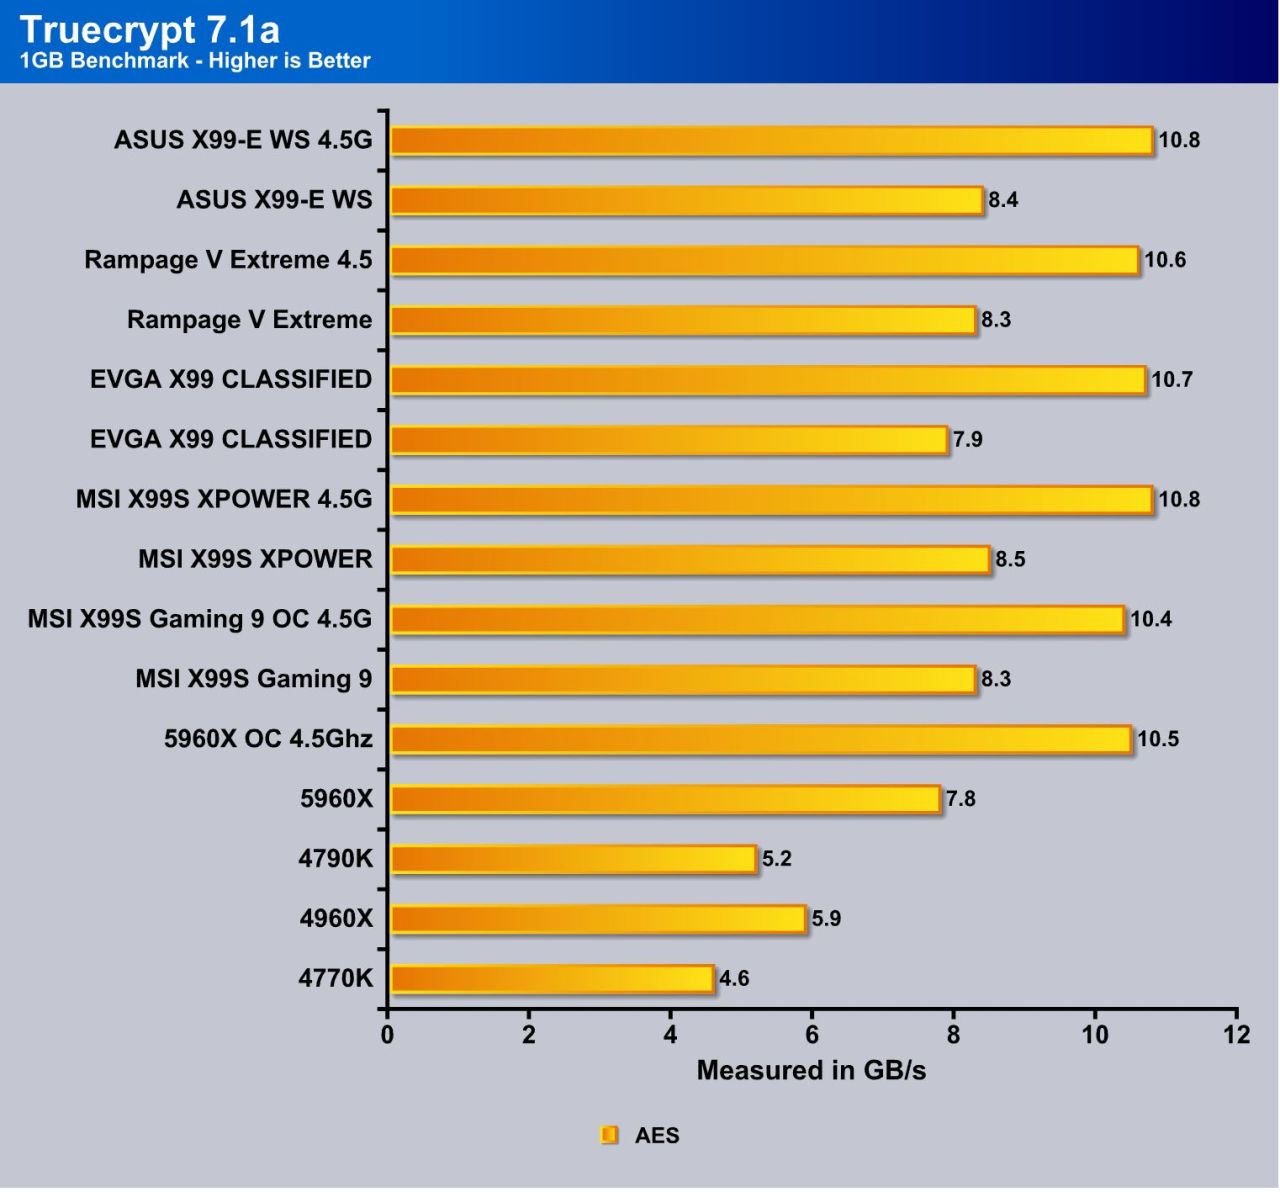
TrueCrypt is a real world application that gives a good indication of the true performance of our latest processor. The AES capability helps push the performance higher in the encryption performance and the super high core count with overclock added gives us out first double digit result in truecrypt on a consumer part. as you can see the outgoing 4960X is easily beaten by 2GB/s stock vs stock which is a huge performance increase.
Unigine Heaven 4.0
 Unigine Heaven is a benchmark program based on Unigine Corp’s latest engine, Unigine. The engine features DirectX 11, Hardware tessellation, DirectCompute, and Shader Model 5.0. All of these new technologies combined with the ability to run each card through the same exact test means this benchmark should be in our arsenal for a long time.
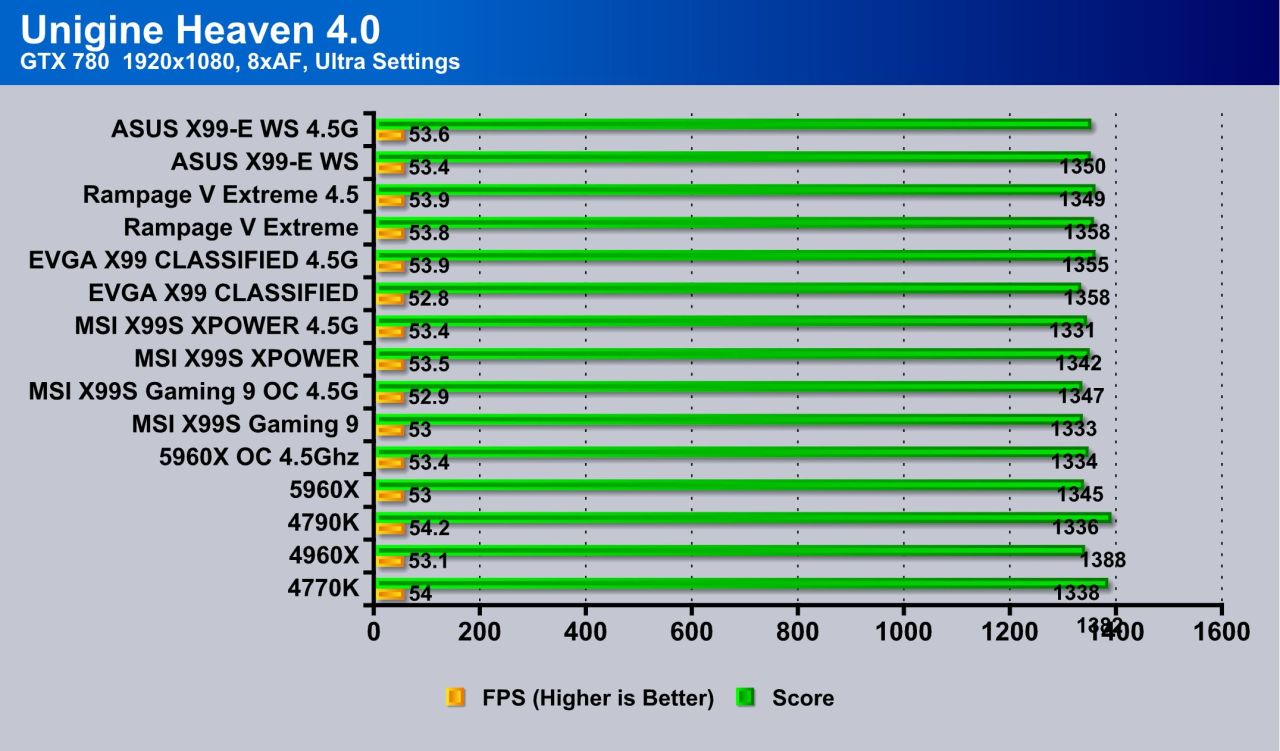
Unigine Heaven on a discrete GTX 780 sees very similar performance as the 3.0 PCIe bus simply moves more than enough data at great efficiency that there is really no major advantage from extra threads here. The thread count and even overclock does little to help here as its simply outguunned by the gamers dream 4790K chip.
Metro 2033
![]()
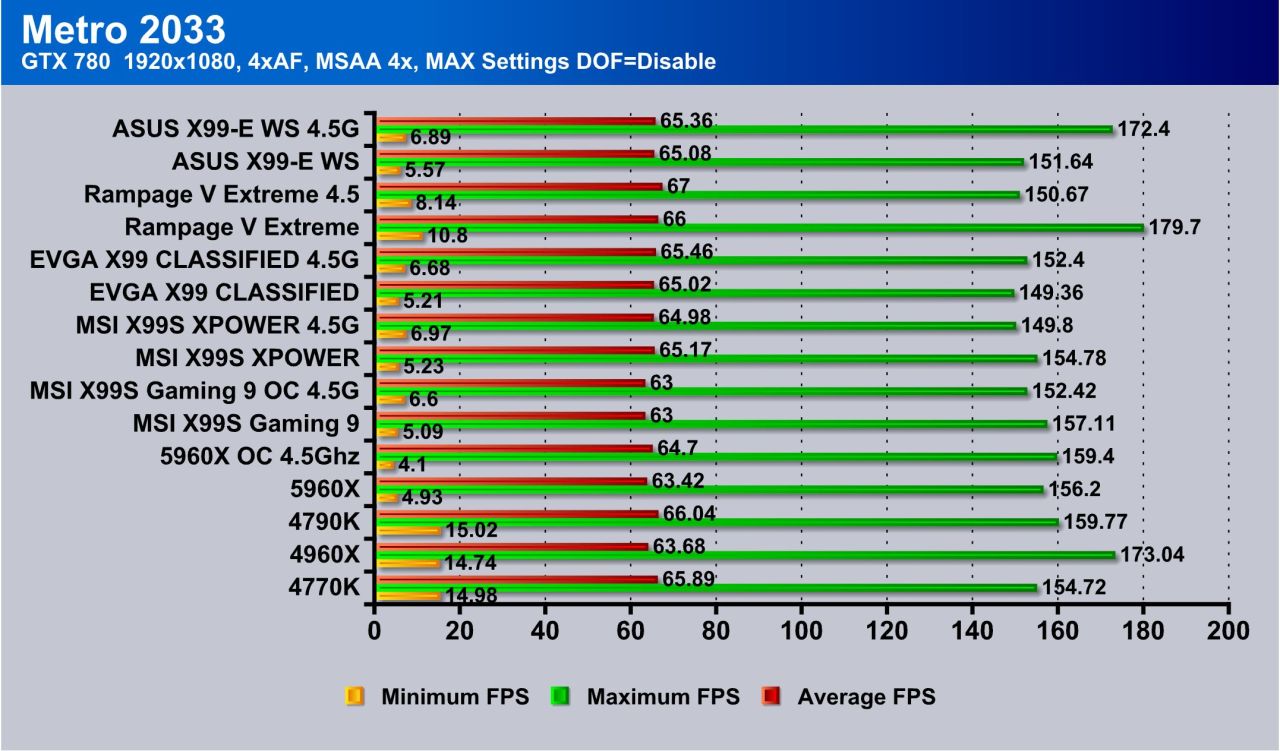
Metro 2033 shows that the minimum FPS is quite low but that could be a bug that disappears as the platform matures. overall the average FPS holds well in the range of the others.
Batman Arkham City

Batman Arkham City has been a staple of our benchmarking suite and its simply because its a fun game to play, its popular and offers many excellent technologies which puts a system to work. Here you can see that at stock the 4790K beats the average FPS against the X99 but when overclocked the X99 can pull ahead some but by the same token im sure the 4790K when overclocked could pull away some as well.
Sniper Elite V2
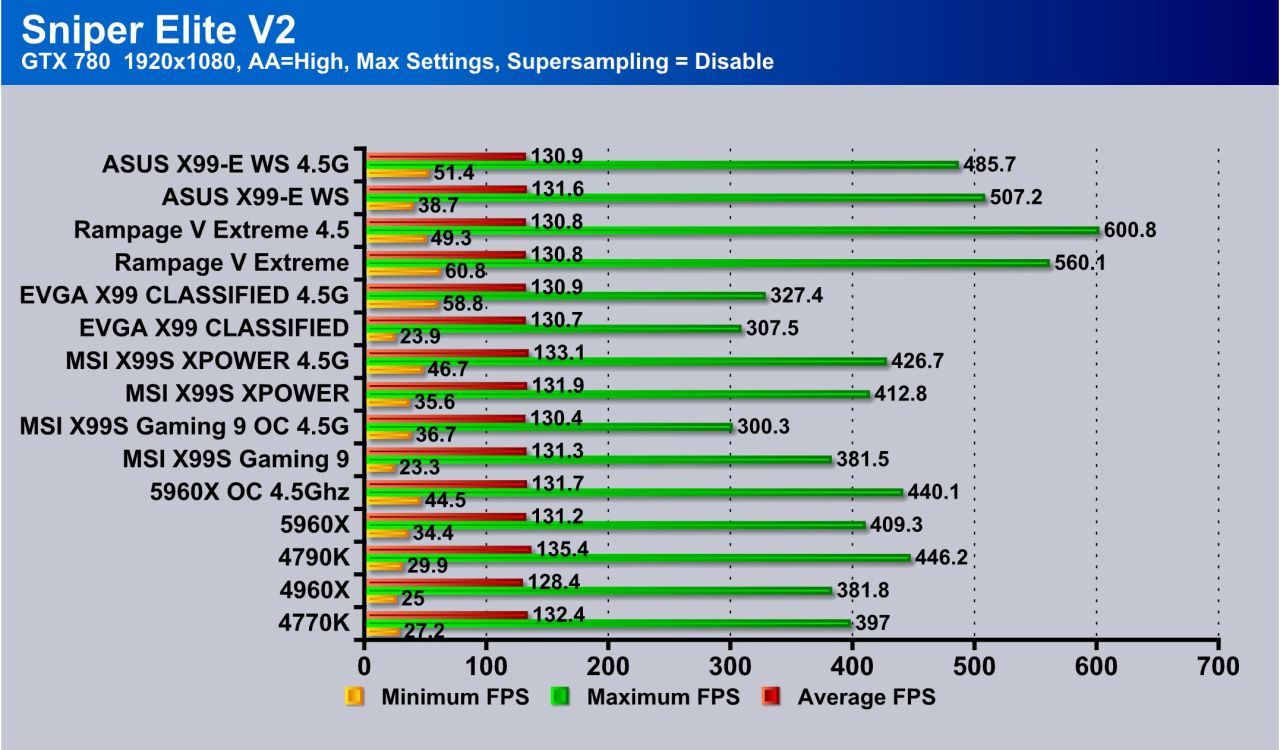
The Sniper Elite V2 shows similar scaling across the board offering well over playable FPS results but the X99 does not jump ahead in any way.
Review Overview
Performance - 9.5
Value - 9
Quality - 10
Features - 10
Innovation - 10
9.7
The X99-E WS is well deserving of the Bjorn3D Golden Bear Award and a masterpiece of high end hardware simply waiting for the right user to put its true potential to work.