Methodology & Testing
We have a previous review of one VisionTek drive of the same model, so the idea here is to recreate the exact conditions from the previous review and compare single drive to two drives in RAID 0.
Lets start this by saying RAID isn’t always the best option, you are dealing with accessing two drives and your random access time will be double that of single drive operation. That means smaller reads and writes done over and over have a longer access time and with such small transactions the longer access time will kill smaller read / write transaction speeds. Fortunately the vast majority of Read and Write transactions are larger. Very few machines or programs want to read or write 64kb blocks all day long. We load large gaming files, large images, and in general larger files.
We turned off the Turbo on the processor and all reduced power states and manually OCed it to 4.4 GHz and it will run at 4.4 GHz all the time with no speed shifting to skew drive benchmarks. We disconnected everything but SSD’s to avoid indexing and unwanted background tests. Antivirus and anti-malware were disabled. Other than those small adjustments we let all the tray icons run, we didn’t strip out the OS or tweak to get better review numbers. We did the default NTFS format on a 128KB RAID 0 array and left it at that.
Test Rig
| Test Rig “Hexzilla” |
|
| Case Type | |
| CPU | |
| Motherboard | |
| Ram | |
| CPU Cooler | |
| Hard Drives | |
| Optical | Liteon DVD Burner |
| GPU | |
| Case Fans | 1 x 180mm Mosfet / CPU / Ram cooling fan 1 x 120mm PCI-E Cooling Fan |
| Docking Stations | None |
| Testing PSU | |
| Legacy | None |
| Mouse | |
| Keyboard | |
| Any Attempt Copy This System Configuration May Lead to Bankruptcy | |
Benchmarks
We aren’t running a competition review it’s two VisionTek 240GB Go Drives ran as stand alone and in RAID 0 so charts would be a little redundant and we are going with screenshots of the results.
Anvil Storage Utilities
Anvil’s Storage Utilities is a lightweight application developed specifically for helping you perform benchmark tests for assessing the performance of a solid-state drive (SSD) or hard disk drive.
Since this is a portable program, it is important to mention that it doesn’t leave any traces in the Windows Registry. You can copy it on any USB flash drive or other devices, and take it with you whenever you need to test the performance of your SSD or hard disk drive on the move.
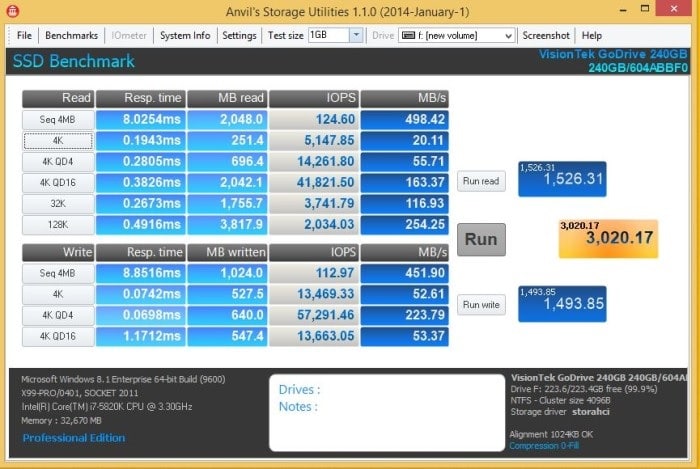
On a single VisionTek 240GB Go Drive we got 498.42MB/s on read and 451.9MB/s Write.
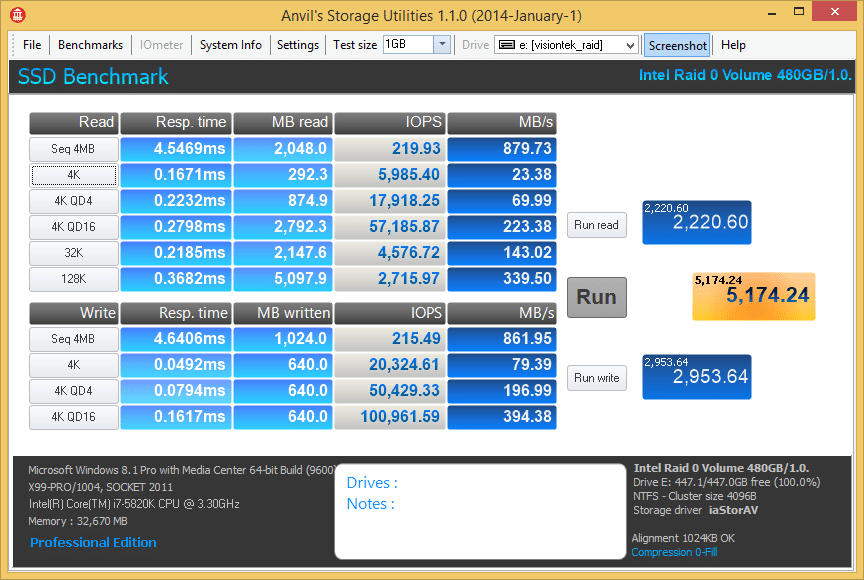
Now with two VisionTek 240GB Go Drives in RAID 0 we hit 879.73MB/s Read and 861.95MB/s Write which are pretty respectable speeds for a couple of relatively inexpensive drives.
Take a look at all the numbers and Anvil confirms RAID 0 speeds up your throughput with compressible date but lets look at in-compressible.
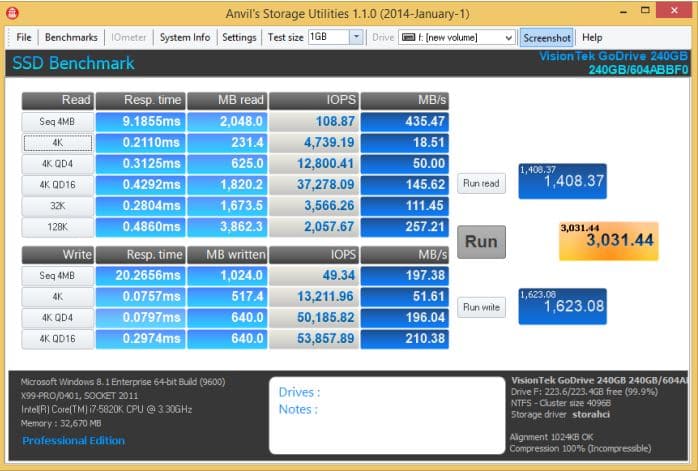
Keep in mind this is 100% in-compressible data, pictures, music and video files are already compressed and considered in-compressible data. SSD’s suffer speed losses from in-compressible data but totally in-compressible data only happens if your copying a large volume of Images, Video or Music. Normal data are a half and half mixture of compressible and in-compressible. Nothing can be done with SSD technology to improve in-compressible speeds at this time so SSD’s are built to take advantage of compressible data simply because it’s better to have that speed boost than operate at non-compressible speeds.

Single Drive hit 435.47MB/s read while RAID 0 got 365.05 and as explained above it’s a combination of access time and In-compressible data The Single Drive 4K write runs at 18.51MB/s while RAID 0 on out Visiontek drives hits 21.22MB/s a slight gain over single drive. The RAID 0 4K QD4 hit 50MB/s single drive while RAID 0 hit 61.66MB/s. What this is show so far is that in general the VisionTek 240GB Go Drives in RAID 0 will be faster.
ATTO
As the industry’s leading provider of high-performance storage & network connectivity products, ATTO has created a widely accepted Disk Benchmark freeware utility to help measure storage system performance. As one of the top tools utilized in the industry, Disk Benchmark identifies performance in hard drives, solid state drives, RAID arrays as well as connections to storage. Top drive manufacturers, like Hitachi, build and test every drive using the ATTO Disk Benchmark.
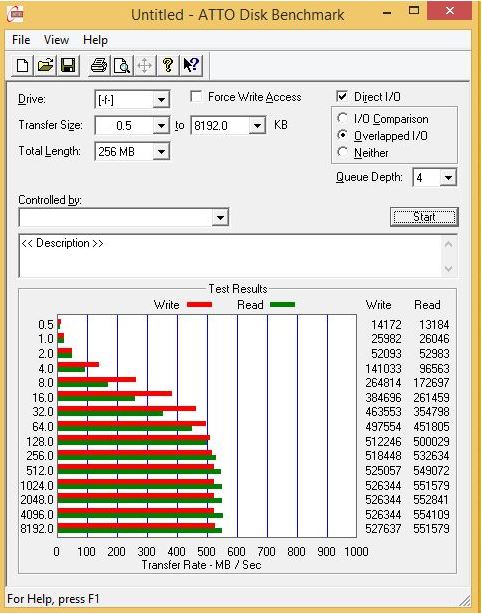
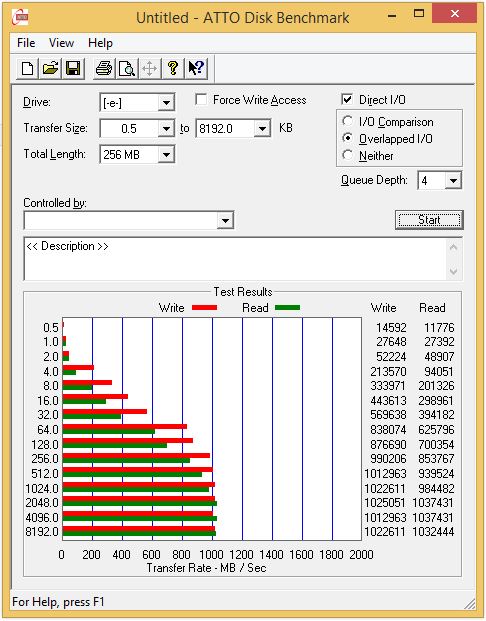
Almost every drive you see on the shelf (or Internet) uses ATTO as the standard measurement of drive speed. One of the reasons is that ATTO uses totally compressible data and that makes for good speed numbers. The single VisionTek drive can’t stand up to the RAID 0 array and Read / Write are in the 527 – 551MB/s range. The RAID 0 array hits above 1000MB/s both read and write. What you have to consider is that around 46% of data is in-compressible so speeds will drop some from the best case shown here.
CrystalDiskMark
From Crystal Dew World: CrystalDiskMark is a disk benchmark software.It measure sequential reads/writes speed,measure random 512KB, 4KB, 4KB (Queue Depth=32) reads/writes speed,select test data (Random, 0Fill, 1Fill),provide theme support and Multi-Language support.
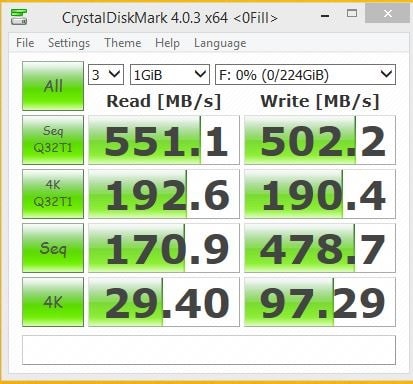

This is CrystalDiskMark using compressible Data and RAID 0 beats single drive in every category except 4K and the access time on the VisionTek Raid 0 array caused the RAID 0 Array to be slower in that one test.

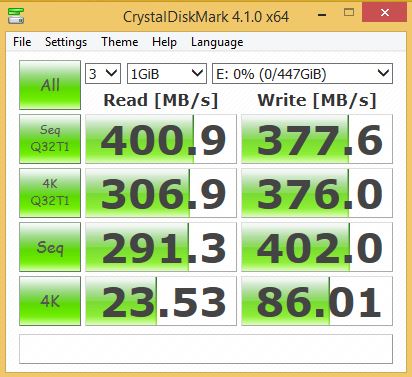
This is the un-compressible test in CDM and things changed a lot. Sequential non-RAID read hits 550MB/s while Raid hits 400.9 a 150 MB/s drop in speed for the RAID array. The 4KQ32TI liked RAID 0 and hit 306.9MB/s on the Visiontek Go Drive Array while single drive got 170.8MB/s on Read, writes got 235.1MB/s single drive and RAID 0 hit 376.0 so RAID got a significant gain in speed there. Sequential is faster in RAID 0 but the small writes of 4K the RAID 0 arrays access time killed the speed and single drive was faster.
DiskMark
DiskMark to clarify is not any part of CrystalDiskMark but an entirely different benchmark.
If you are curios about your hard drive’s performance, DiskMark can provide you with the information you need. This lightweight utility can benchmark your hard disk to determine its reading and writing speeds. It lets you make a few simple configurations, but it does most of the work for you.
The application is absolutely free and you can have it up and running in just a few seconds, on Windows 2000 or any later edition, up to Windows 8. It provides support for both 32 and 64-bit operating systems and it doesn’t have any special requirements. Also, the application does’t use a significant amount of resources, so it works even on older machines.
The compact user interface displays two graphs which are filled automatically once you start a benchmarking process. The application writes and reads certain data packages to determine the hard disk’s performance and it lets you choose a size for this package, as well as the number of rounds and runs it should make.
When launched, DiskMark will immediately display the options for targeting a drive, setting a package size and so on. Besides local drives, the application is capable of benchmarking removable drives as well. Once your settings are done, which should take only a few seconds, you only need to click a button and the test will start right away.
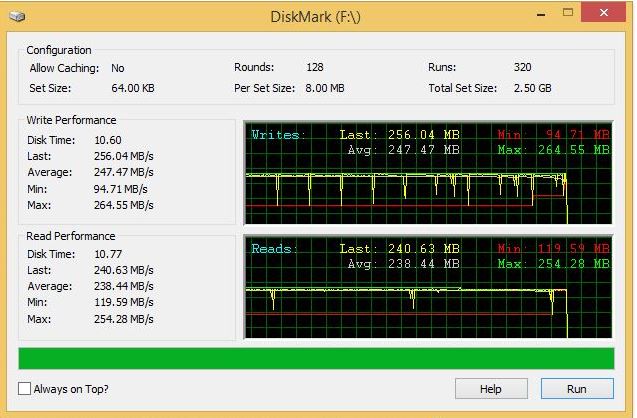
DIskMark the disk time tells the whole story, it took a single drive 10.50 seconds to do the job while the VisionTel Go Drive Raid 0 array took 7.52 seconds a time savings of over 3 seconds.
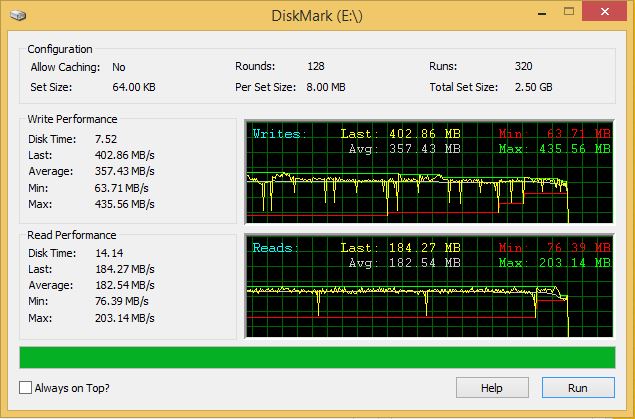
Single drive the VisionTek Go Drive hit 247.7MB/s Write while the RAID 0 array hits 357.43MB/s around 110MB/s faster on the RAID 0 Array. Read performance sees a flip-flop and Single drive hits 238.44 while RAID 0 hits 182.54 but this was 64KB sized blocks so the access time probably hurt the reads.
Hard Drive Tune Pro
HD Tune Pro is a hard disk / SSD utility with many functions. It can be used to measure the drive’s performance, scan for errors, check the health status (S.M.A.R.T.), securely erase all data and much more.
HD Tune Pro is adjustable so bear with us it’s the last benchmark but we spent some time in HD Tune Pro adjusting and testing.
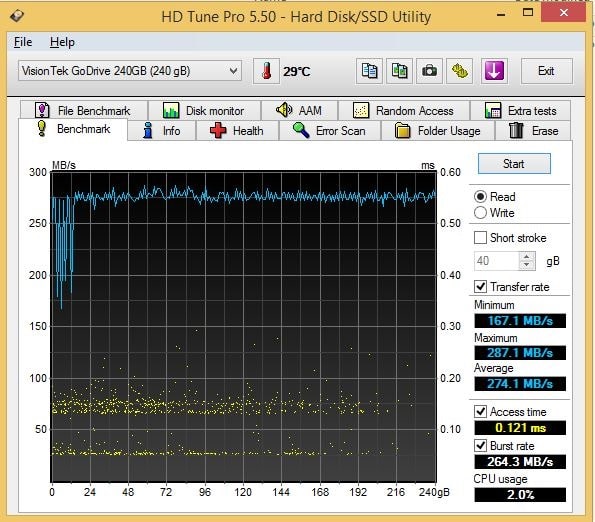
Check the Access time single drive coming in at 0.121 while the RAID image below hits 0.232ms and you can see what we mean by double the access time for RAID. Not only that but single drive uses the CPU at 2% while the RAID array is at 6.6% now HD Tune Pro’s CPU usage isn’t the most precise measurement but that’s a considerable difference.
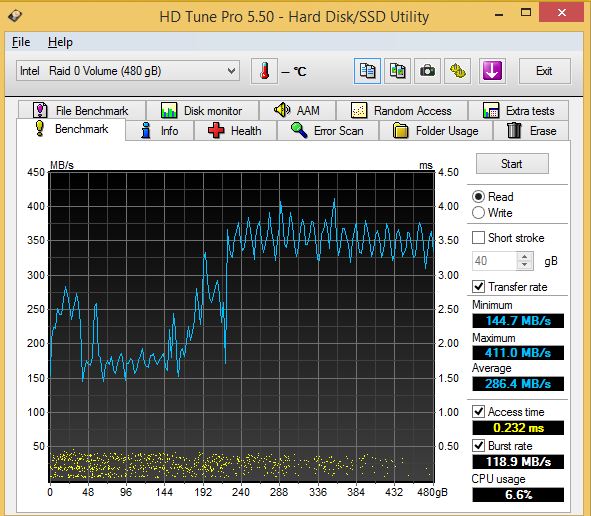
This is the default settings in HD Tune Pro and what we are concerned with is average performance which hits 286,4MB/s in RAID 0 but in single drive it hits 271.4 so there’s just not much difference in HD Tune Pro which prompted us to do some investigative tuning and retesting.
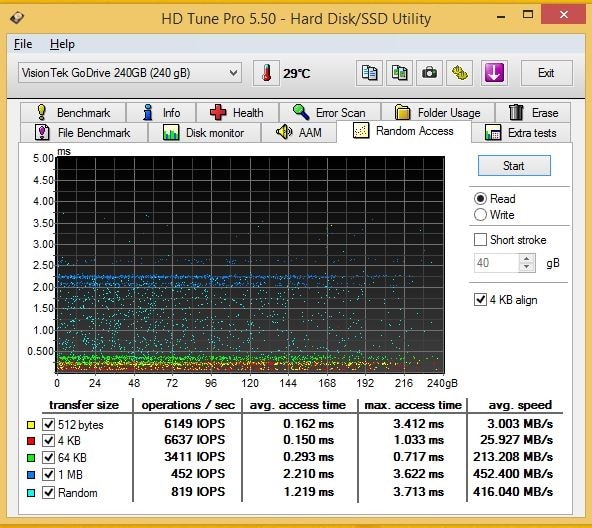
What we are seeing random access is using a lot of small transfer sizes which is good for platter drive testing but not SSD.
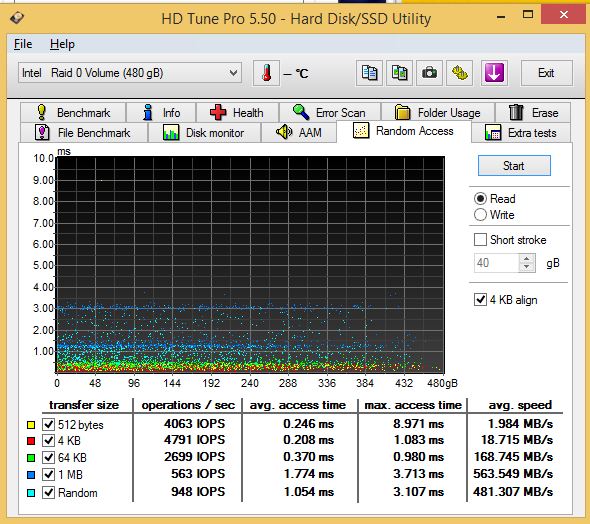
On RAID 0 only one test beat single drive and that is the 1MB test and with these small transfer sizes we aren’t sure if this will weigh into scoring or not but we put it out there for you to ponder.
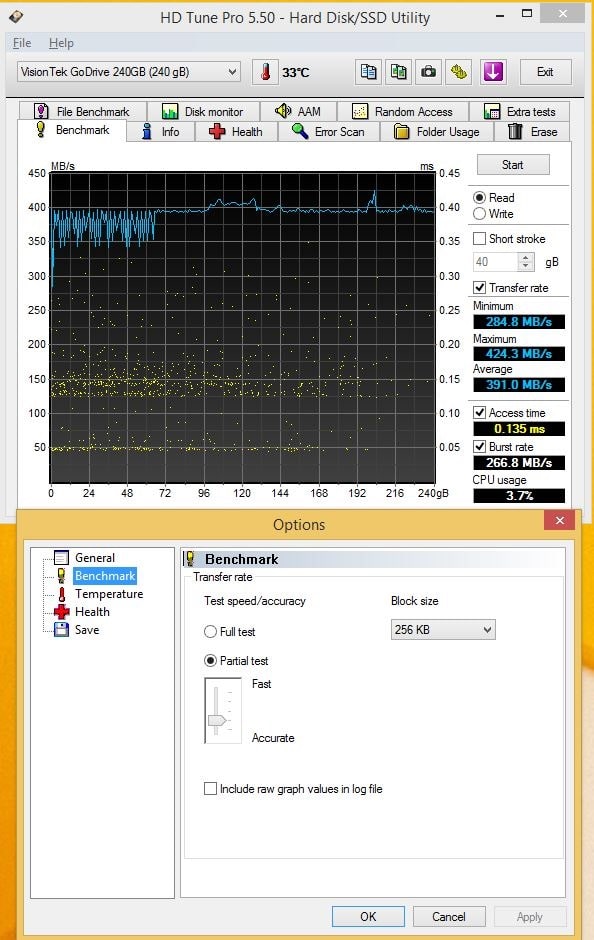
We adjusted the transfer block size to 256KB and our average speed jumped to 391MB/s so you see how much transfer size can affect a test. Default settings single drive were 274.1MB/s so jumping the transfer size up got us 117MB/s increase in speed.
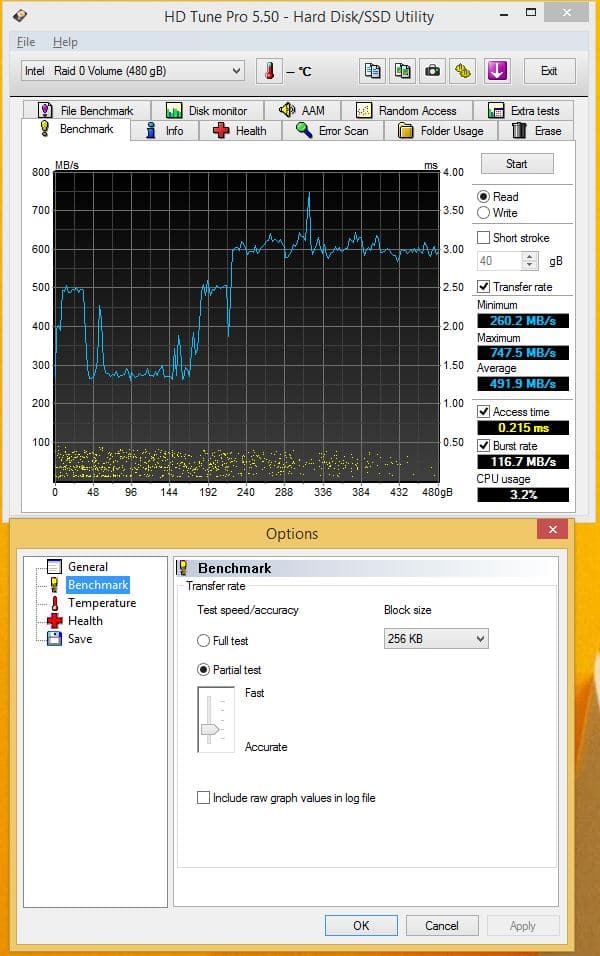
Same test in HD Tune Pro with the VisionTek RAID 0 array got us a whopping 491.9MB/s compared to single drive at 391MB/s so we got 100MB/s speed increase.
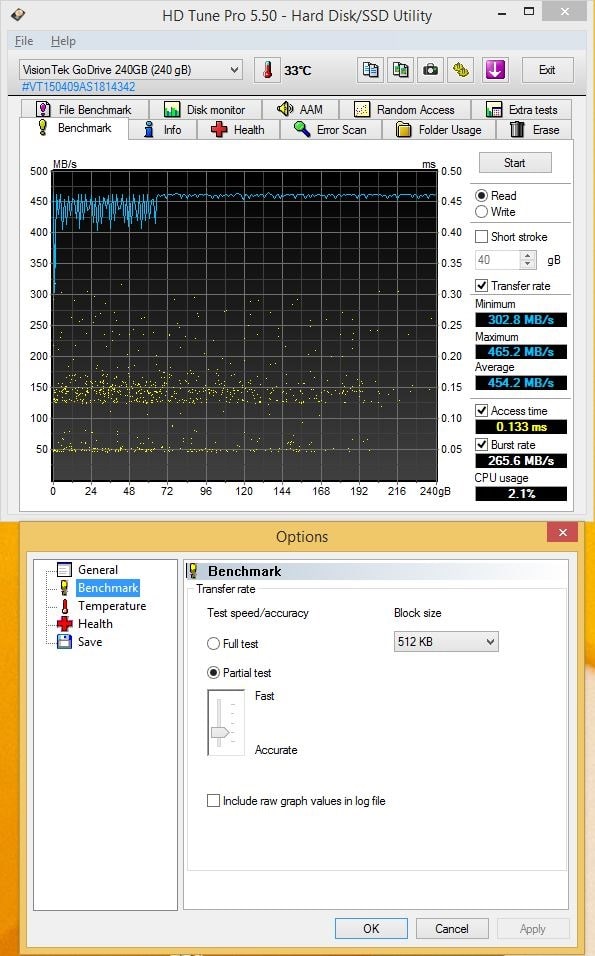
Jumping block size to 512KB gets us a single drive average of 454.2MB/s and as you see larger block sizes mean higher transfer speeds. We fail to understand why benchmarks always want to run 64KB as default and why so many reviews run default without exploring the setting and options. Often all you see is the default run and someone who doesn’t know any better sitting there making a judgement on a test he doesn’t understand.

Our RAIDed VisionTek drives give us an average of 609.3MB/s on a 512KB test while single drive gave us 454.2MB/s so probing into HD Tune Pro we see the benchmarks default settings far to low to be much good for SSD testing. As block size increases the RAID Array leverages its dual drive advantage.