Many of you use Futuremark’s benchmarking tools to see just how well your system performs, and many of you submit those benchmark results online to compare your results to thousands of other users. If you’ve ever wondered how many of you use AMD processors and how many use Intel or if you are curious to see how quickly the Athlon64 processor is being adopted, check out this article.
Introduction
I have no doubt that most, if not all, of you have heard of MadOnion, Futuremark or 3DMark. If not, here’s the short story. Futuremark used to be known as MadOnion, and it makes some of the most popular benchmarking applications available, including 3DMark2001, 3DMark2003 and PCMark04. The 3DMark benchmark applications are of course used to test 3D gaming performance, and they also allow users to submit benchmark results online for comparison with other users. While Futuremark does not collect personal information from these users, it does collect pertinent system information, such as video card and CPU.
![]()
Those of you familiar with and interested in statistics are no doubt immediately pondering the countless uses of such collected data. Then, you might realize the value of such data. That value has led Futuremark to offer data services, such as selling this type of data to companies and working with companies in their own market research by enabling them to capture this information from online survey respondents. For more information about Futuremark’s data services, visit the following web page: www.futuremark.com/products/dataservices.
Thanks to the Futuremark crew, we have been granted an exclusive look at some of the data submitted by 3DMark03 users. Futuremark provided us with CPU data that covers June 2003 to December 2003. During this time, one of the most exciting CPU developments was AMD‘s release of the Athlon 64 processors. In this article, I will not only show you the distribution of AMD and Intel CPUs in Futuremark’s collected data but also the distribution of Athlon 64 processors. So keep reading if you’d like an answer to any of the following questions: Which company, AMD or Intel, is more popular overall, according to the collected data? Is AMD’s popularity increasing? Is Intel’s popularity increasing? How fast is the Athlon 64 being adopted?
A Little Info About the Data and Statistics
Before I dive into the graphs showing you the trends that answer these questions, I feel obligated to quickly discuss the data sample and statistics in general. The data presented comes from a small sample of the population of all PC users. That is why any trends presented can only be labeled as trends and not facts. Trends can show us if a product is getting more or less popular over time for example, but they cannot show us the exact percentage of people who will buy product X next month. On the other hand, you could use a trend to help you predict that percentage if you so desired. For instance, if a trend shows that product Y is losing 5% market share in January, February and March, then it’s logical to predict that it might lose more market share in April as well. You could even go as far as to guess that it will be a 5% drop again, but something (and it could be almost anything) could cause that trend to change and April be completely different than expected. That is why a person must be very careful about using trends for predicting the future.
Okay, so trends are trends and facts are facts. We have that all straight, but what is a sample? A sample is basically just a portion of the population. The population can basically be any group, such as 40 year old males, college graduates or Bjorn3d readers. In this instance, the population is you — PC users and enthusiasts — and the sample is the thousands of people who have submitted their 3DMark03 results online. In this case, the sample size changes each month. For your reference, here are the sample sizes for each month. Recall that the data covers June 2003 to December 2003.
| MONTH | TOTAL |
|---|---|
| June | 34,051 |
| July | 32,693 |
| August | 31,270 |
| September | 32,861 |
| October | 34,680 |
| November | 28,597 |
| December | 13,557 |
The Trends – AMD vs. Intel and Athlon 64 Popularity
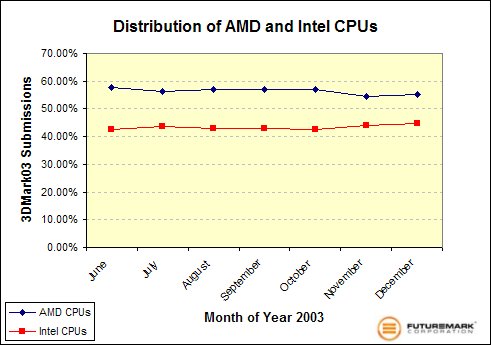
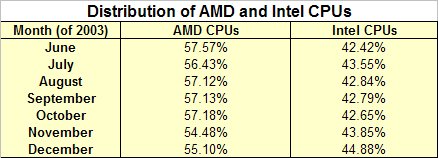
If you decided to click on a link that led you to this article, here’s the info you’ve been waiting for. First, let’s take a look at the overall distribution of CPUs to give us an idea of which company’s (AMD’s or Intel’s) processors are in the most PCs.
Source: Futuremark Corporation
Source: Futuremark Corporation
You can see that AMD is represented in 54 – 57% of the users’ submissions over the time period, which means Intel’s share is 43 – 46%. Considering that many of us are driven by the bang for the buck gauge, this isn’t really too surprising since AMD’s chips are generally much cheaper than Intel’s while providing comparable performance. Interestingly, this picture is quite different from the world’s CPU market share.
There is more to this AMD versus Intel story though. The following graph shows a different trend.
Source: Futuremark Corporation
Source: Futuremark Corporation
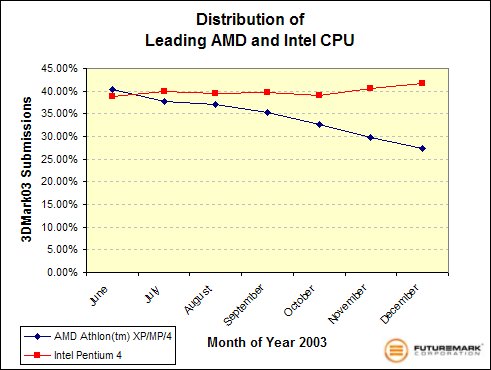
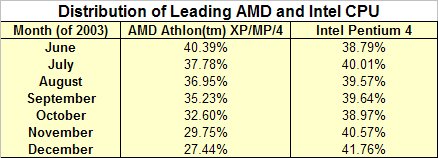
In this graph, the comparison is between the two companies leading CPU groups, which is the Athlon XP/MP/4 for AMD and Pentium 4 for Intel. While AMD’s Athlon XP/MP/4 group has decreased considerably in relative popularity over the last several months (from 40.39% in June 2003 to 27.44% in December 2003), the Intel Pentium 4 has gradually increased its share (from 38.79% in June to 41.76% in December). In fact, the Pentium 4 is the largest group from July to December, with a 14% advantage in December. Surely, the ease of overclocking the ‘C’ processors has helped the P4 gain ground.
To help you better understand the numbers and in case you are really mulling over these relationships, I’m also including one of the individual month’s results in table form. I chose the December values since they are the most recent.
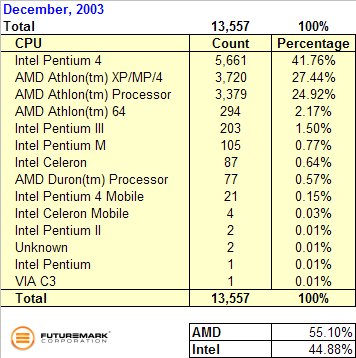
Source: Futuremark Corporation
A Respite from the AMD vs Intel Battle
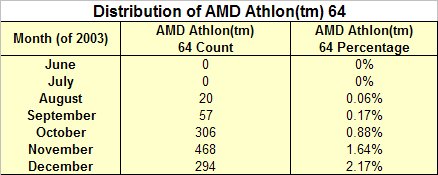
So, AMD is winning one battle and Intel is winning another. This is very interesting indeed. Let’s get off the battlefield for a moment though to look at the final trend. This final graph shows the increase in popularity of the Athlon 64 processors.
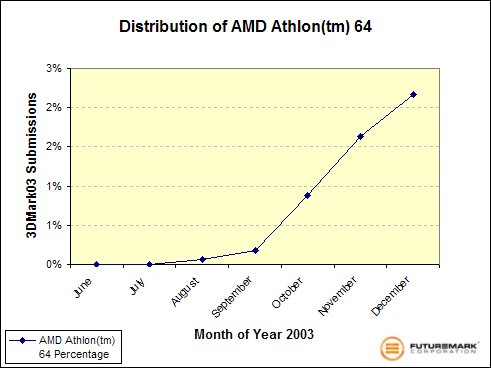
Source: Futuremark Corporation
Source: Futuremark Corporation
Although the numbers are small, the trend is impressive. The Athlon 64 first showed up in Futuremark’s system in August at an unremarkable 0.06% share. September saw this percentage almost triple, but it was still a measly 0.17% or 57 submissions. In October, the Athlon 64 experienced a five-fold increase to 0.88%, and then its popularity doubled the next two months, finally hitting a more impressive 2.17% in December. Considering that the Athlon 64 really wasn’t very affordable until the recent release of the 3000+, I think this increase is quite interesting. The 64-bit crowd is growing despite the lack of readily available 64-bit programs and despite the fact that the cheapest Athlon 64 processor is $200.
Conclusion
Whether you click away from this article thinking, “He didn’t tell me anything I didn’t know already” or “Wow. That’s some interesting stuff,” I hope you were at least a little entertained when looking at the actual numbers. Does any of this prove anything? Nope, but at least now AMD and Intel fanboys alike have some new ammo for their next silly argument about which processor is better. 😉
Seriously though, what have we learned from Futuremark’s data. First, among 3DMark03 users, AMD processors are overall more popular than Intel processors. Second and despite the first, the Intel Pentium 4 has become the most popular processor ‘group’ by far. Finally, the Athlon 64 processors are gaining popularity, which is not much of a surprise since we all know our community is full of enthusiasts and early-adopters.
I’d like to once again thank Futuremark for making this article possible. Feel free to visit our forums to discuss the findings, and thanks for reading!


