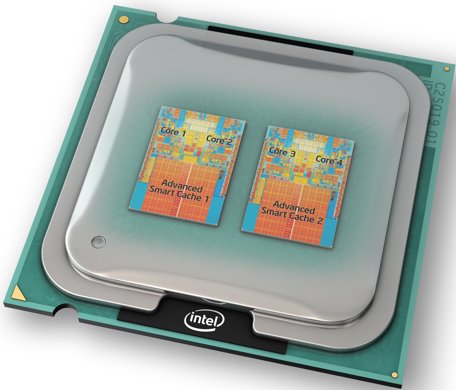
Intel’s new line of Core I7 Processors (Nehalem) will change the face of computing. The Core I7 940 currently the Top Mainstream processor impressed us from the start.
INTRODUCTION
It’s that time again. Intel is releasing its Core I7 940 2.93GHz CPU, code named Nehalem. While it might be hard to remember and spell, it’s a true joy to drive. The Core I7 940 processor we’ll be taking a look at today impressed us on so many levels that it’s hard to capsulize the effect it had on us. From the moment we popped it into it’s larger socket 1366 home we were blown away by the increase in performance we saw.
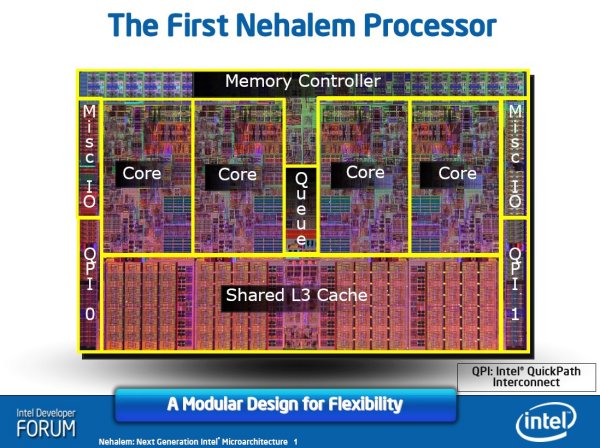
With it’s native Quad design incorporating an Integrated Memory Controller, and sharing a huge 8MB L3 cache, it was love at first bench. We know that you’re all aching to know if they overclock. That’s probably the number one question we’ve been getting. You’ll be glad to know they overclock better and easier than any quad we’ve ever had our hands on. If you’ve got an existing quad, be afraid, be very afraid. If you’re not driving one of these beauties, you’re not going to be happy until you are.
About Intel
Intel pushes the boundaries of innovation so our work can make people’s lives more exciting, fulfilling, and manageable. And our work never stops. We never stop looking for the next leap ahead—in technology, education, culture, manufacturing, and social responsibility. And we never stop striving to deliver solutions with greater benefits for everyone.
It began with the Intel® microprocessor, the invention that sparked a revolution. Intel’s history of developing groundbreaking technology continues today. We attract the most brilliant minds in science to push the boundaries of innovation and further our position as the world’s leader in semiconductor technology. Our passion is to create technology that changes the world.
THE EVOLUTION
We’re not going to go all the way back to single core processors, but we wanted to revisit the evolution of processors leading us to Core I7.
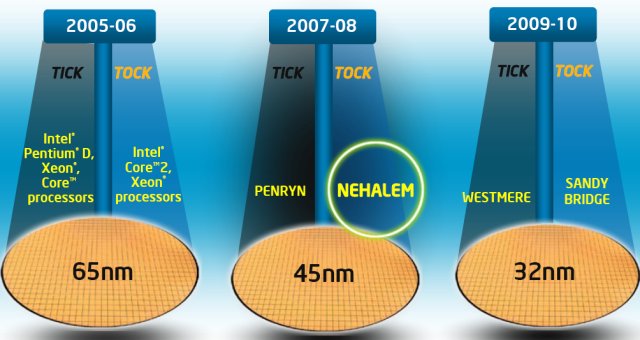
In 2005-2006 we saw 65nm dominating the market, in 2007 45nm Penryn hit the streets, and 2008 ushers in 45nm Nehalem where we are today. Up and coming (projected) we see the 32nm Westmere and Sandy Bridge slated for 2009-2010.
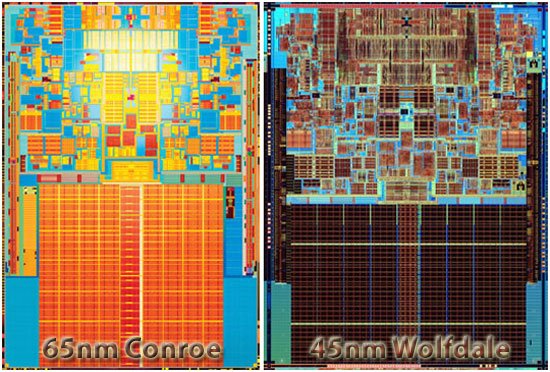
Starting with the 65nm Conroe dual core we saw a die size of 143mm2 and 291 million transistors. Then Intel upped the ante with the downsized Wolfdale and its 45nm core packing 119 million new transistors and a die size of 107mm2 with 410 million transistors.
Then someone got the idea of throwing two dual cores onto one die and the Core 2 Quad (double cheeseburger) design was born. Intel Core 2 Quads like the QX9650 sported 2 x 410 million transistors in a two dual core on one die design that is 107mm2 in size.
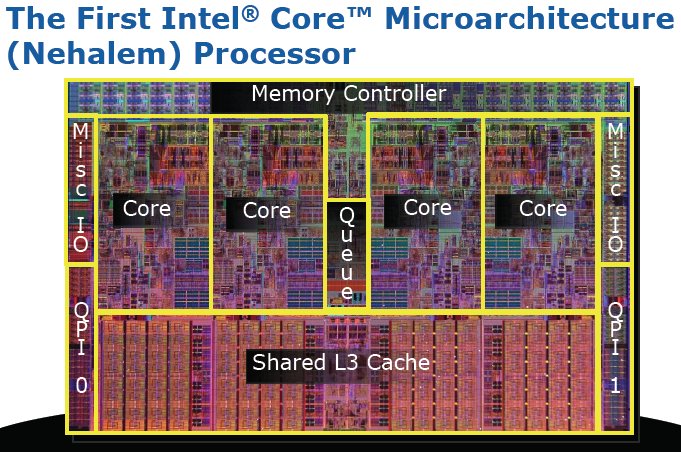
Which brings us to Core I7 (Nehalem) where we’re at today. Core I7’s initial release is a 45nm design with a die size of 263mm2 and 731 million transistors. While the Core 2 Quad design had more transistors, it’s a less efficient design than Core I7 which is a true Quad design and gets an additional boost from Hyper-Threading. Not only does Nehalem get a boost from Hyper-Threading, but it also gets a boost from a huge 8MB shared L3 cache. Previous generations of Intel CPU’s only had L1 and L2 Cache
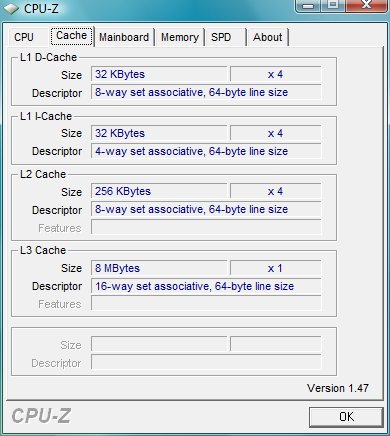
If you take a look at the CPU-Z screen shot you can see that there are 4X 32KB L1 Data Caches, one for each core, then again 4X 32KB L1 Instruction Caches, and L2 Cache is 4X 256KB. Then the L3 cache is a whopping 8MB shared cache.
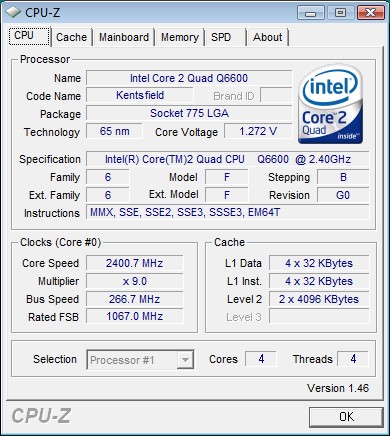
Rolling back time a little and looking at the CPU-Z screen shot of our much loved Q6600, you see L1 Data and Instruction Cache are both 4X 32KB and Level 2 cache is 2X 4096. So we’ve gained a Cache with Core I7. Where on the Q6600 Core 2 Quad we had L1, and L2 and L2 was split between the two physical CPU’s setting on one die, we now have L1 and L2 cache and an 8MB single shared L3 cache.
This brings up another Nehalem fine point, Hyper-Threading. While Core I7 has four physical cores, Hyper-Threading splits each core into two logical cores so your four physical cores become eight virtual cores. What’s that all about you ask?
It’s just what it sounds like. Nehalem gains significant advantage from splitting the four physical cores into eight logical cores. The splitting of the four physical cores into the eight logical cores is the result of Hyper-Threading. Interestingly enough, on our Intel Smackover X58 board Hyper-Threading can be disabled in the BIOS.
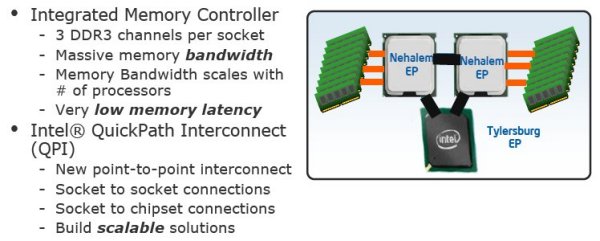
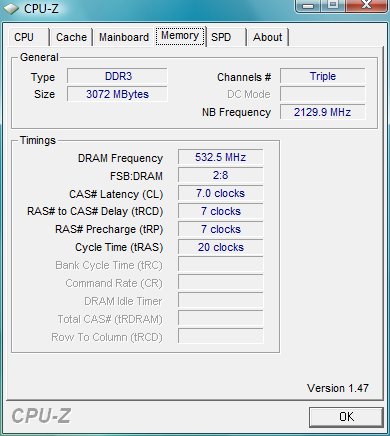
The next big improvement in Core I7 is the integrated memory controller that Intel has implemented. It provides more memory bandwidth via the QPI (Quick Path Interconnect). We’re not talking about a little more memory bandwidth, were talking double and even triple the memory bandwidth of previous Intel CPU’s.
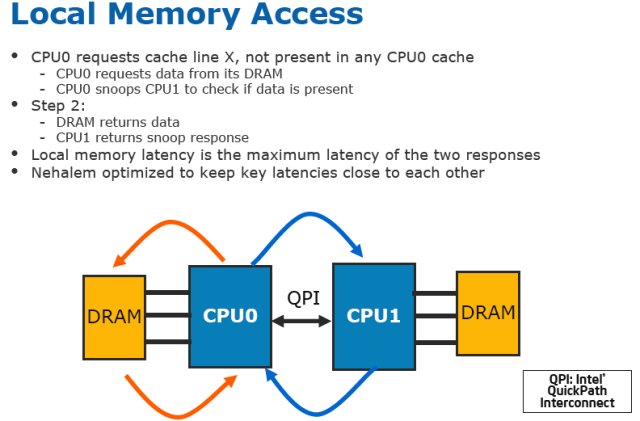
In this example, CPU0 checks it’s own cache and if the data isn’t there then it requests it from its DRAM. In the mean time it checks CPU1 to see if the data is already there, then it pulls the data from DRAM, and CPU1 issues it’s response to the snoop request. By closely coordinating that dance, latencies consist of the longest response to the original request.
Now, how can we get out of this without some really cool pictures? Well, we can’t, but you’ll have to move on to the next page for those.
FEATURES
| Intel Core i7 Processor Series Key Features & Specifications |
||||
| Intel Core i7 965 Extreme Edition |
Intel Core i7 940 1 | Intel Core i7 920 | ||
| Clock Speed | 3.2 GHz | 2.93 GHz | 2.66 GHz | |
| QPI Speed (GT/s) | 6.4 | 4.8 | 4.8 | |
| CPU Socket | 1366 | 1366 | 1366 | |
| Shared L3 Cache | 8 MB | 8 MB | 8 MB | |
| Memory | DDR3 Triple Channel | DDR3 Triple Channel | DDR3 Triple Channel | |
| TDP | 130 Watts | 130 Watts | 130 Watts | |
| Overspeed Protection | Removed | Enforced | Enforced | |
| Architecture | New Intel 45 nm Nehalem |
New Intel 45 nm Nehalem |
New Intel 45 nm Nehalem |
|
| Quad Core | Yes | Yes | Yes | |
| Key Platform Features |
|
|||
- Nehalem Innovations
- Dynamically managed threads, cores, cache, interfaces, and power
- Simultaneous multi-threading (SMT) for enabling a more energy efficient means of increasing performance for multi-threaded workloads
- Innovative extensions to the Intel Streaming SIMD Extensions 4 (SSE4) that center on enhancing XML, string, and text processing performance
- Superior multi-level cache, including an inclusive shared L3 cache
- New high-end system architecture that delivers from two to three times more memory bandwidth
- Performance-enhanced dynamic power management
CORE I7 WAFER & DIE
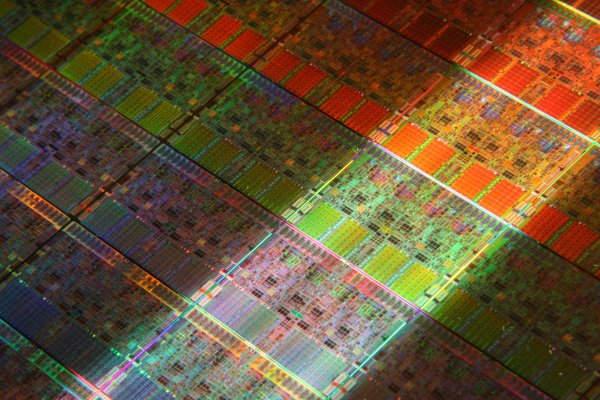
We thought we’d start this section a little differently than is traditionally done, so let’s take a look at a Core I7 Wafer. There’s not really a lot we can say about it but it looks really cool.
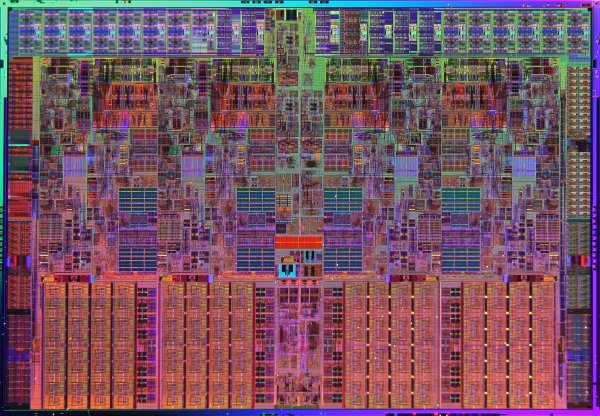
It just looks better without the diagram on top.
That really doesn’t give you an idea of how large the processor is…
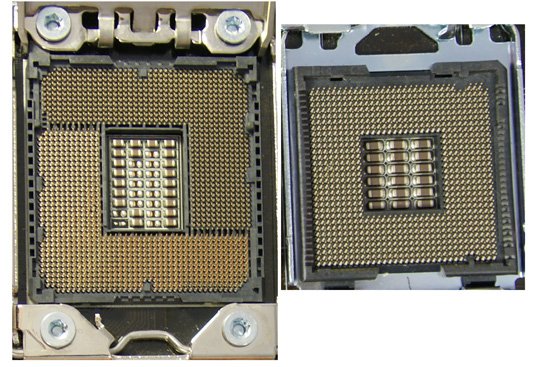
so we got a shot of the 775 socket and put it next to the 1366 socket Core I7 occupies.
The socket on the left is, of course, the larger socket 1366, home of Core I7.

PICTURES & IMPRESSIONS
We have a lot to cover in the Pictures & Impressions section this time, so let’s get right after it.

We were quite surprised to see the scope of the generous Core I7 Kit we received from Intel. It was really hard to resist ripping the boxes open and heading straight to the testing station.
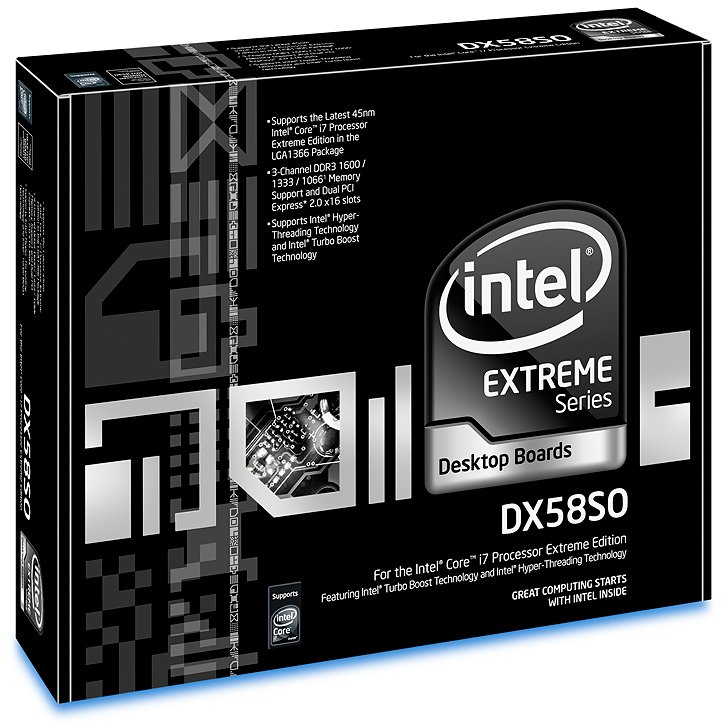
We received the brown box version of the Intel Desktop DX58SO Extreme but that would have been kind of boring so we located a shot of the retail box for you to lust after.

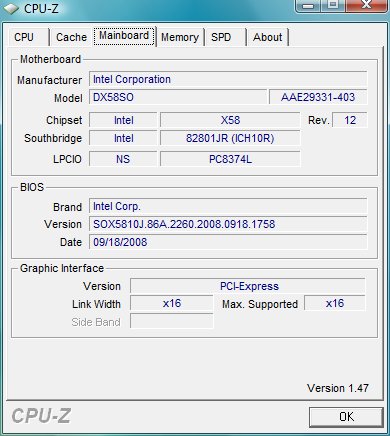
There’s a detailed look at the Smackover board, but if you want good detail click the picture for a larger layout shot.
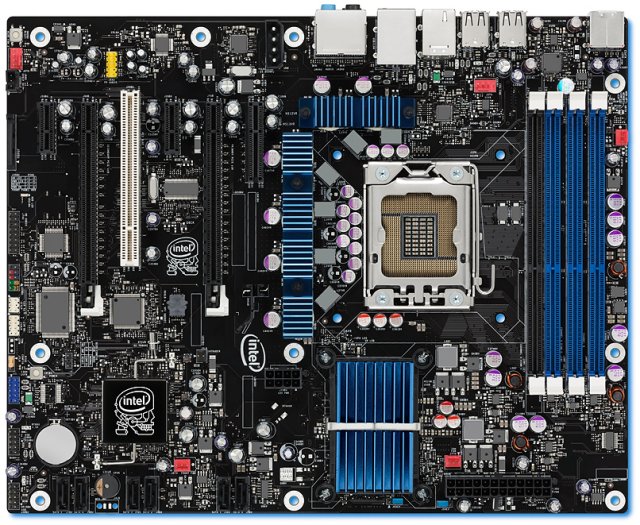
Then there’s a good look at the Smackover Board before we got it on the bench. Notice the three blue ram slots, the designated home for our triple channel ram kit.
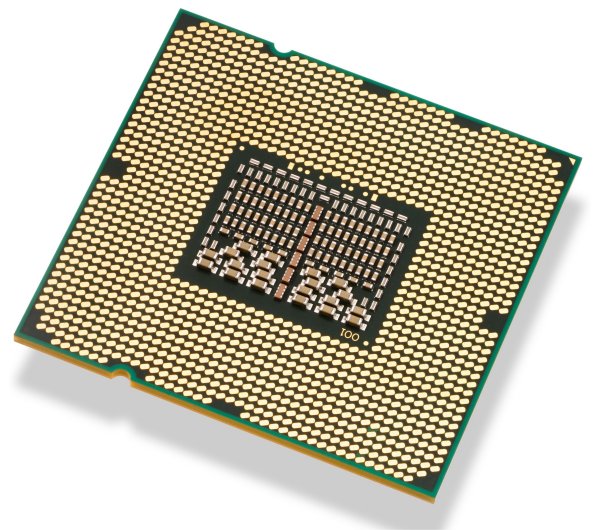
There’s a shot of the Core I7 CPU we have on the bench. Just the words “Intel Confidential” are enough to make benchmarking fever spread like wildfire and we spent the better part of two days benching this beast without stopping. By that time, we figured we’d better record some of the benches and got down to a full week of extensive testing. From the looks of our Core I7, and the little ring evident on the surface, someone else has run their fingers across our Core I7, so we’re afraid we’ll have to hunt them down and make sure it wasn’t a mere mortal that handled this beast.
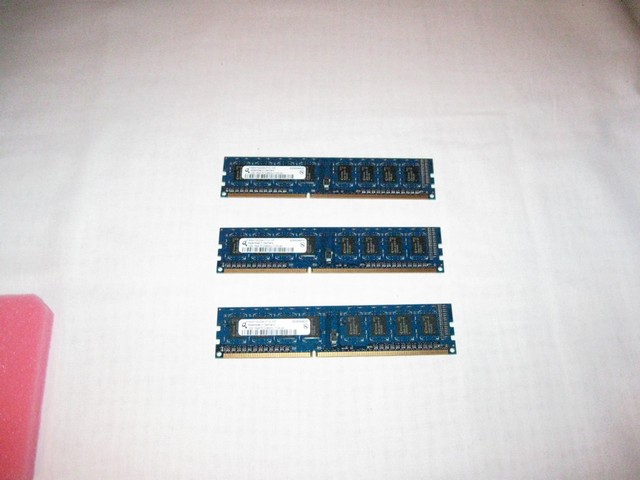
There’s the Triple Channel Samsung Qimondo 3 X 1GB DDR3 1067 CL7 non-ECC UDIMM’s we used during testing. Don’t let its unassuming looks fool you. This ram is smokin’!
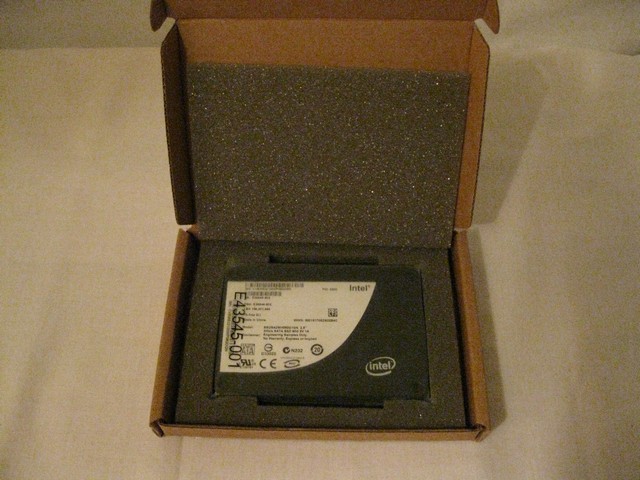
There’s a shot of the Intel High Performance SATA SSD X-25-M 80GB drive we received with the kit. It promises up to 250MB/s read and 70MB/s write speed, so we’re quite excited to get it on the test bench!
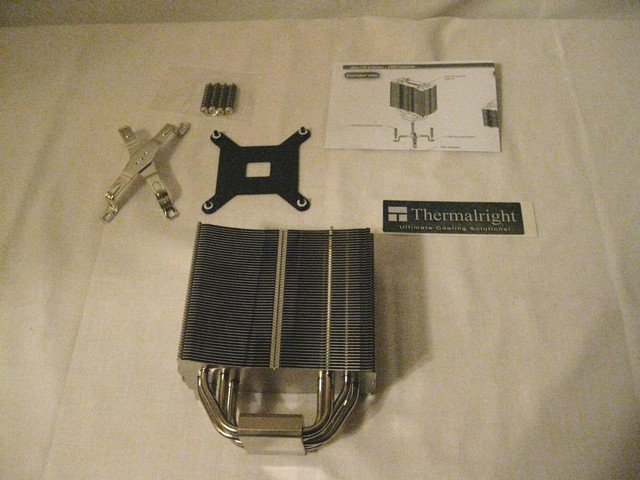
We also received a Thermalright Ultra-120 RT for use with the Core I7 965 Extreme CPU, as well as a stock cooler for the Core I7 920. We tested the 965, 940, and 920 with the Thermalright cooler, and on the 920 we tried out the stock cooler. We know which one we prefer. The Thermalright Ultra provided much better performance.
TESTING & METHODOLOGY
We did a fresh load of Windows Vista 64 on the test rig, then once we updated the software and drivers to the latest versions, we made a clone copy of the hard drive because we’re going to run this beast like we stole it. We ran each test a total of six times and the average of each test is reported here. We could have gotten by with three runs of each test, but we were having too much fun with the kit so we went for six runs to get a more accurate average than normal.
Test Rig
| Test Rig | |
| Case Type | High Speed PC Tech Station |
| CPU | Core I7 940 2.93 GHz |
| Motherboard | Intel BX58SO Smackover |
| Ram | Samsung Qimonda DDR3 1067 CL7 1.56v |
| CPU Cooler | Thermalright Ultra 120 RT |
| Hard Drives | Intel SSD X25-M 80GB MLC |
| Optical | Sony DVD R/W |
| GPU | BFG GTX-260 OCX MaxCore |
| Testing PSU | Thermaltake Toughpower 1000 Watt Modular |
| Mouse | Razer Lachesis |
| Keyboard | Razer Lycosa |
| Gaming Headset | Razer Piranha |
| Speakers | Logitech Dolby 5.1 |
Comparison Rig
| Test Rig “Quadzilla” |
|
| Case Type | Thermaltake Armor ESA |
| CPU | Intel Q6600 @ 3.6 Voltage 1.4875 vcore |
| Motherboard | EVGA 790i |
| Ram | OCZ DDR3 2000 MHz |
| CPU Cooler | Swiftech DIY Watercooling |
| Hard Drives | WD 250 Gig SATA II Two Maxtor 160 GB SATA II |
| Optical | Sony DVD R/W |
| GPU | BFG GTX-260 OCX MaxCore In SLI |
| Case Fans | Two 120mm Thermaltake Front/Rear Push/Pull 250mm Side fan 90mm Rear Exhaust 90mm Top Exhaus |
| Docking Stations | Tagan IB290 W/Deskstar 2 1/2 Inch 80 GB SATA II Tagan IB390 W/Maxtor 160 GB SATA II Thermaltake BlackX USB W/Seagate 80 GB SATA II |
| Testing PSU | Thermaltake Toughpower 850 ESA Modular |
| Legacy | Floppy Drive |
| Mouse | Razer Lachesis |
| Keyboard | Razer Lycosa |
| Gaming Headset | Razer Piranha |
| Speakers | Logitech Dolby 5.1 |
| Any Attempt Copy This System Configuration May Lead to Bankrupcy | |
Test Suite
|
Synthetic Benchmarks |
|
POV Ray 3.7 Beta |
|
3DMark Vantage v. 1.01 |
|
3DMark06 v. 1.1.0 |
|
SiSoft SANDRA XII Professional SP2 |
|
Everst Ultimate Edition v. 4.50.1330 |
|
SuperPi Mod 1.5XS |
|
HD Tach RW 3.0.1.0 |
|
Cinebench R10 64 bit |
|
WinRar v. 3.71 |
|
Games |
|
Crysis v. 1.02 |
Sisoft SANDRA 2009 Professional SP1
“SiSoftware Sandra (the System ANalyser, Diagnostic and Reporting Assistant) is an information & diagnostic utility. It should provide most of the information (including undocumented) you need to know about your hardware, software and other devices whether hardware or software. It works along the lines of other Windows utilities, however it tries to go beyond them and show you more of what’s really going on. Giving the user the ability to draw comparisons at both a high and low-level. You can get information about the CPU, chipset, video adapter, ports, printers, sound card, memory, network, Windows internals, AGP, PCI, PCI-X, PCIe (PCI Express), database, USB, USB2, 1394/Firewire, etc.”
The Core I7 940 shows a strong performance at stock speeds. It’s almost as fast as the 965 at stock speed. Unfortunately, we couldn’t test it for OC (overclock) speed because we’re down clocking the 965 Extreme to get the Core I7 940 benches. If it overclocks like it’s brethren you can expect to be able to hit 3.6GHz and higher without much effort which will significantly increase its performance.
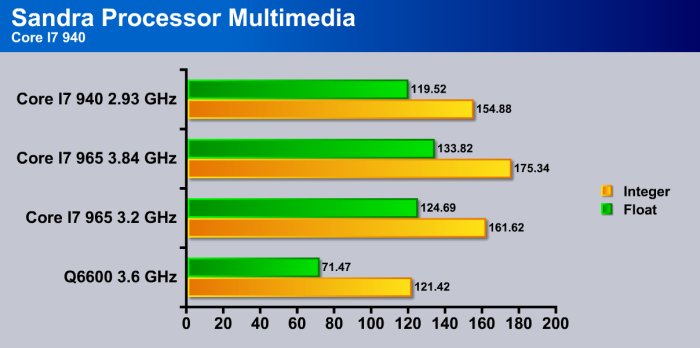
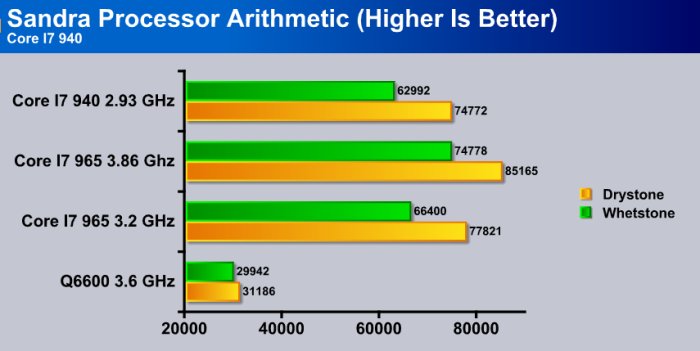
Intel wasn’t kidding when they said Core I7 will show significant gains over previous generations of their CPU’s. Both the Core I7 965 and 940 do significantly better than the Q6600 in Sandra’s Processor Multimedia test.
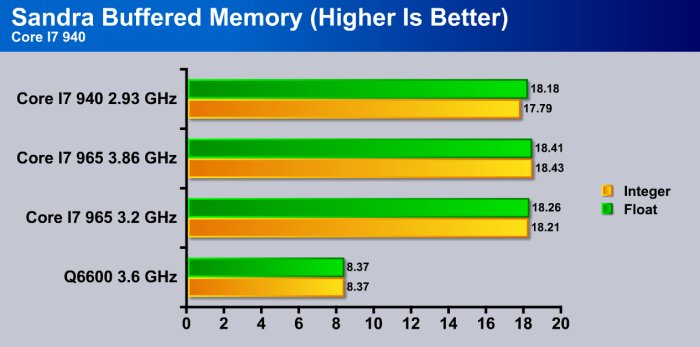
In the Buffered Memory test we expected great things from Core I7 and we got fantastic results. More than twice the bandwidth of the Q6600 which was running much faster DDR3 2000. The Core I7 was running DDR3 1066 Samsung memory. We can, at this point, only imagine what Core I7 will do with faster memory!
EVEREST ULTIMATE V.4.6
“EVEREST Ultimate Edition is an industry leading system diagnostics and benchmarking solution for enthusiasts PC users, based on the award-winning EVEREST Technology. During system optimizations and tweaking it provides essential system and overclock information, advanced hardware monitoring and diagnostics capabilities to check the effects of the applied settings. CPU, FPU and memory benchmarks are available to measure the actual system performance and compare it to previous states or other systems. Furthermore, complete software, operating system and security information makes EVEREST Ultimate Edition a comprehensive system diagnostics tool that offers a total of 100 pages of information about your PC.”
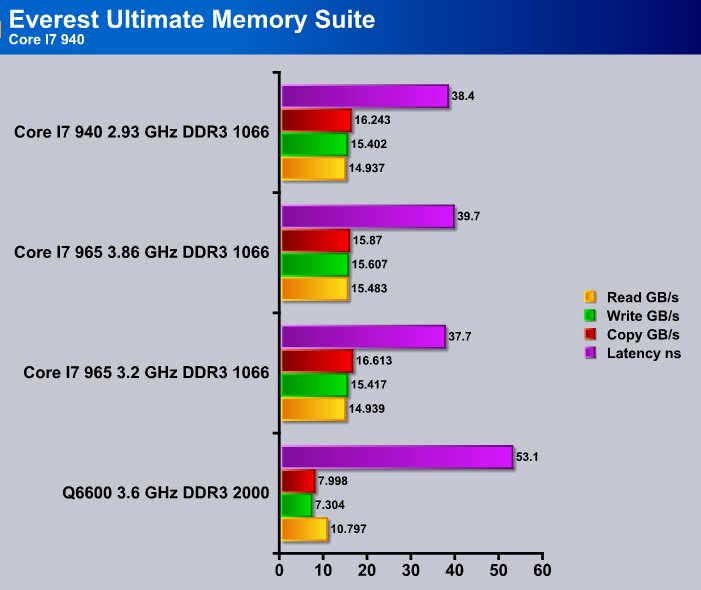
We’re seeing about twice the bandwidth using Core I7, for a single generation leap with the new IMC (Integrated Memory Controller), doubling the bandwidth from previous generations is quite a feat. We can’t wait to see the results with faster ram.
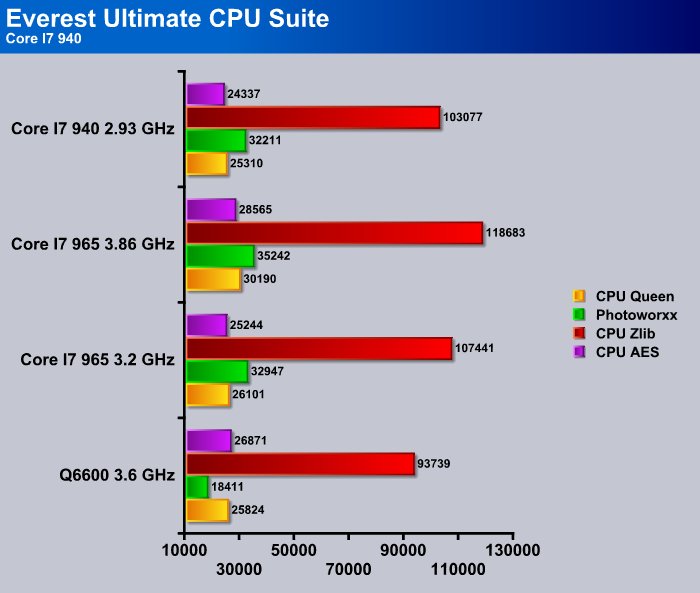
The Core I7 940 at stock speed came in just behind the higher clocked Q6600, but that would change quickly if we were able to overclock it. Since we’re using the Core I7 965 down clocked to simulate the 940, it wouldn’t be fair or accurate to report overclocking numbers. Even given those conditions, the 940 still beat the Q6600 in Zlib, smashed it in Photoworxx, and came close in CPU Queen. Give it a little OC bump and it will leave the Q6600 in the dust.
CINEBENCH & HDTACH
Cinebench
The test procedure consists of two main components: The first test sequence is dedicated to the computer’s main processor. A 3D scene file is used to render a photo-realistic image. The scene makes use of various CPU-intensive features such as reflection, ambient occlusion, area lights and procedural shaders. In the first run, the benchmark only uses one CPU (or CPU core), to ascertain a reference value. On computers that have multiple CPUs or CPU cores and on those who simulate multiple CPUs (via HyperThreading or similar technolgies), MAXON CINEBENCH will run a second test using all available CPU power. The second test measures graphics card performance and is run inside the 3D editor window. The project file used can test all graphics cards that support the OpenGL standard. In this scene, only the camera was animated. This scene places medium to low demands on graphics cards and tests the maximum speed with which the scene can be properly displayed.

Hands down across the board both the Core I7 940, and 965 Extreme trounced the Q6600 solidly. Cinebench is liking the Core I7.
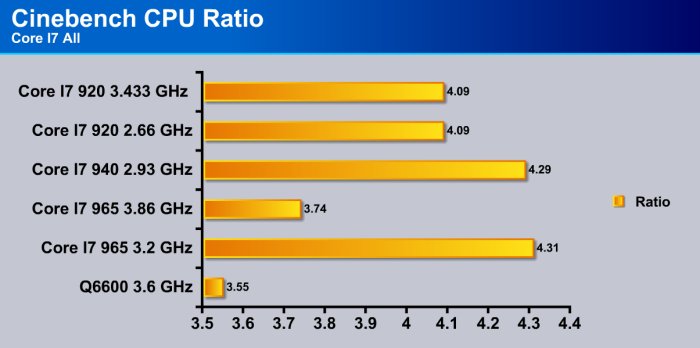
For some reason not clear to us, when we overclocked the 965 Extreme we lost some core efficiency, other than that it exceeded four cores, which is pretty good for a Quad CPU. It’s Hyper-Threading. Had you going for a second there.
HDTach
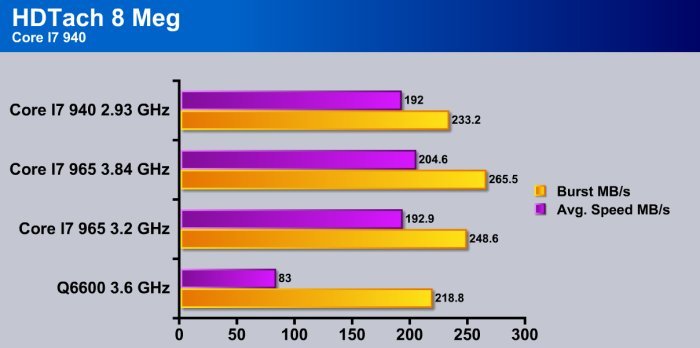
HDTach is more about the hard drive than the system, but since we have the new Intel 80Gb SSD (Solid State Drive) to play with, we had to bench it and show it off. We’re not much concerned with burst speeds, we’re more interested in sustained transfer speeds. The Intel SSD outperforms the Sata 2 drive by a more than 200%. That’s more than twice as fast. We’re liking the SSD!
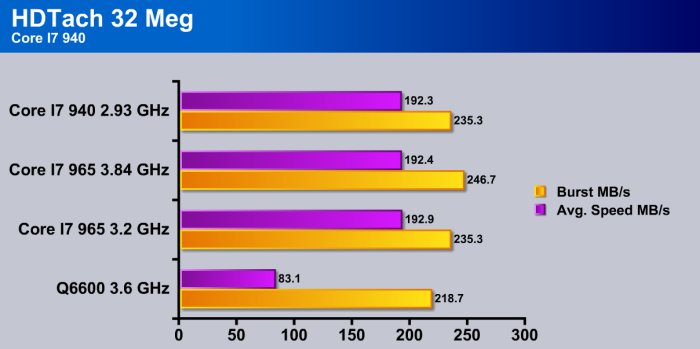
The 32MB long test in HDTach gives us the same story, confirming the superiority of the Intel SSD design. The SSD drives are expensive but they run so fast it makes a tremendous difference in the snappiness and load times on the machines we’ve tested it on.
HD Tach is a low level hardware benchmark for random access read/write storage devices such as hard drives, removable drives (ZIP/JAZZ), flash devices, and RAID arrays. HD Tach uses custom device drivers and other low level Windows interfaces to bypass as many layers of software as possible and get as close to the physical performance of the device possible.
SUPERPI & WINRAR
SuperPI
SuperPi is the “Gold Standard” for many when it comes to judging system performance. We ran 1 and 2 Meg calculations, again running each test three times and reporting the average of the results.
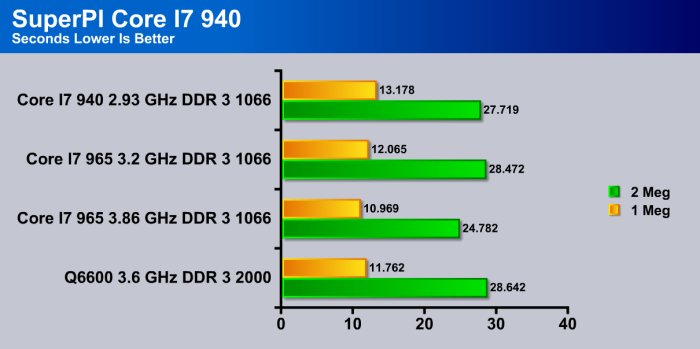
With the Q6600 running DDR3 2000 we’re not seeing a whole lot of difference in SuperPi. Given that the Core I7 is running DDR3 1066 ram and performed on the same level that’s pretty amazing.
WinRar v. 3.71
This module in WinRar generates random data, which contains specially introduced redundancy, increasing the load to both the processor and memory. Data is the passed through RAR compression and decompression algorithms, and the output of the decompression algorithm is compared to the source data. If any differences are found, WinRAR then reports “Errors found – Yes” in the command window. WinRAR displays a size of processed data and compression speed, current and resulting, in kilobytes per second.
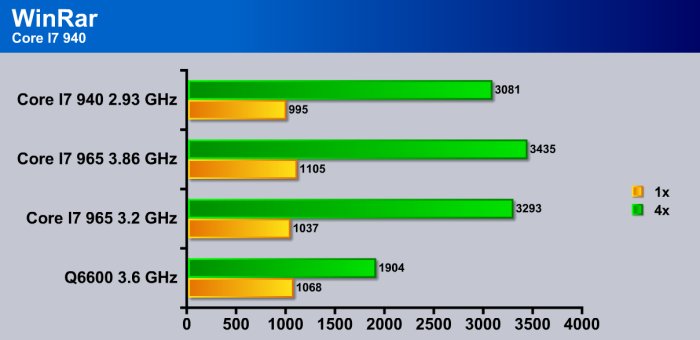
Not much difference in single core single thread operations here but when you go to multicore multithreaded, the Core I7 demonstrates its superiority with authority.
POV-RAY & CRYSIS
POV-Ray
POV-Ray has matured substantially since it was created. Recent versions of the software include the following features:
- A Turing-complete scene description language (SDL) that supports macros and loops.
- Library of ready-made scenes, textures, and objects
- Support for a number of geometric primitives and constructive solid geometry
- Several kinds of light sources
- Atmospheric effects such as fog and media (smoke, clouds)
- Reflections, refractions, and light caustics using photon mapping
- Surface patterns such as wrinkles, bumps, and ripples, for use in procedural textures and bump mapping
- Radiosity
- Image format support for textures and rendered output, including TGA, PNG, JPEG (only input) among others
- Extensive user documentation
POV-Ray is extremely good at multi-threading and good for testing the efficiency on multi-core CPU’s.
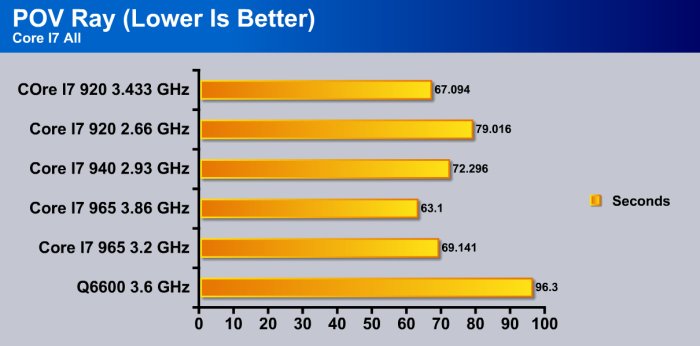
Pov-Ray is a new benching tool for us, and we have to say we’re liking it for multi-core and multiple threaded applications and CPU’s. The Q6600 was beaten by every Core I7 we tested at every speed. In one case by as much as 32.8 seconds faster. About 33% faster in that case, for video editing that means greatly decreased times when rendering frames.
Crysis v. 1.2

Crysis is the most highly anticipated game to hit the market in the last several years. Crysis is based on the CryENGINE™ 2 developed by Crytek. The CryENGINE™ 2 offers real time editing, bump mapping, dynamic lights, network system, integrated physics system, shaders, shadows, and a dynamic music system, just to name a few of the state-of-the-art features that are incorporated into Crysis. As one might expect with this number of features, the game is extremely demanding of system resources, especially the GPU. We expect Crysis to be a primary gaming benchmark for many years to come.
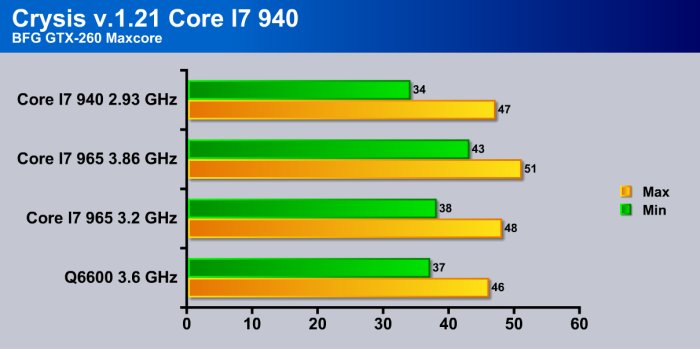
The BFG GTX-260 Maxcore was almost maxed out on the Q6600 rig so we didn’t expect a large increase in Crysis, but Core I7 managed to squeeze out a few extra frames.
3DMARK06 v.1.1.0 & 3DMARK VANTAGE
3DMark06

3DMark06 developed by Futuremark, is a synthetic benchmark used for universal testing of all graphics solutions. 3DMark06 features HDR rendering, complex HDR post processing, dynamic soft shadows for all objects, water shader with HDR refraction, HDR reflection, depth fog and Gerstner wave functions, realistic sky model with cloud blending, and approximately 5.4 million triangles and 8.8 million vertices; to name just a few. The measurement unit “3DMark” is intended to give a normalized mean for comparing different GPU/VPUs. It has been accepted as both a standard and a mandatory benchmark throughout the gaming world for measuring performance.
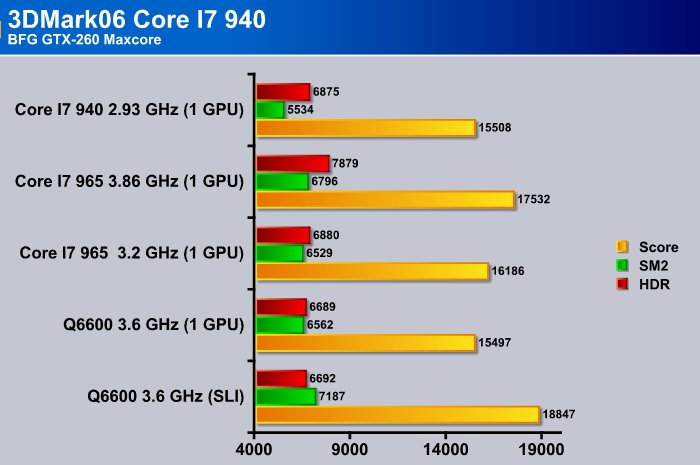
Our Q6600 has been getting throughly beaten about the head and neck so we decided to throw in a little SLI action in 3DMark06 so it could feel a little better about itself. Leveling the playing field and backing off to single GPU vs Single GPU though, once again it was left in the dirt wondering what blew past it.
3DMark Vantage

For complete information on 3DMark Vantage Please follow this Link: www.futuremark.com/benchmarks/3dmarkvantage/features/
The newest video benchmark from the gang at Futuremark. This utility is still a synthetic benchmark, but one that more closely reflects real world gaming performance. While it is not a perfect replacement for actual game benchmarks, it has its uses. We tested our cards at the ‘Performance’ setting.
Currently, there is a lot of controversy surrounding NVIDIA’s use of a PhysX driver for its 9800 GTX and GTX 200 series cards, thereby putting the ATI brand at a disadvantage. Whereby installing the PyhsX driver, 3DMark Vantage uses the GPU to perform PhysX calculations during a CPU test, and this is where things get a bit gray. If you look at the Driver Approval Policy for 3DMark Vantage it states; “Based on the specification and design of the CPU tests, GPU make, type or driver version may not have a significant effect on the results of either of the CPU tests as indicated in Section 7.3 of the 3DMark Vantage specification and white paper.” Did NVIDIA cheat by having the GPU handle the PhysX calculations or are they perfectly within their right since they own Ageia and all their IP? I think this point will quickly become moot once Futuremark releases an update to the test.
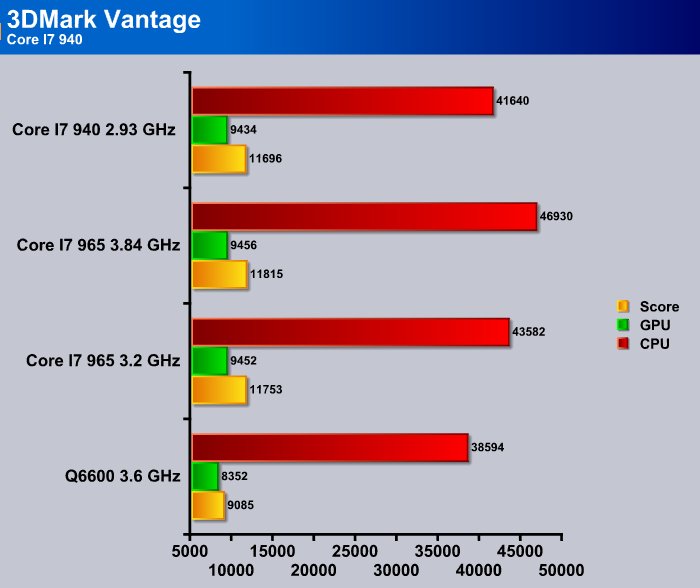
In 3Dmark Vantage the Q6600 got slapped around pretty good. Even considering PhysX in the equation, all the testing was done with PhysX so the increase in CPU score is soley attributable to the greater computing power of the Core I7.
VOLTAGES,TEMPS, OVERCLOCKING, & GOODIES
Voltages
| Power Consumption In Watts Tested with GTX-260 or GTX-260 in SLI unless noted |
|||||
| Idle | Load | ||||
| Gigabyte EP45-Extreme Q6600 | 173 | 295 | |||
| Gigabyte EP45-DQ6 Q6600 | 167 | 283 | |||
| Asus P5KC Q6600 | 160 | 281 | |||
| EVGA 790i Q6600 (SLI Running) | 215 | 451 | |||
| EVGA 790i Q6600 (Single GPU) | 172 | 307 | |||
| Intel DX58SO Core I7 965 (Single GPU) | 181 | 325 | |||
| Intel DX58SO Core I7 965 (Single GPU 4870×2) | 191 | 376 | |||
| Intel DX58SO Core I7 940 (Single GPU) | 190 | 322 | |||
| Intel DX58SO Core I7 920 (Single GPU) | 192 | 320 | |||
Core I7 series really isn’t taking any more voltage than previous generations. You can only read so much into the voltage readings. They’re taken with a Kill A Watt power meter and reflect whole system power consumption. Idle was taken at the desktop with no unneeded background tasks running. Load was taken with Prime95 driving all four physical cores, all eight logical cores as hard as they could go. We were also looping 3Dmark Vantage while running Prime95 to get maximum power consumption.
Temperatures
| CPU Temperature Core I7 Series |
|||||
| Core I7 965 3.2 GHz Stock Voltage | 29C | 49C | |||
| Core I7 965 3.86 1.275 Vcore | 41C | 59C | |||
| Core I7 940 2.93 GHz Stock Voltage | 29C | 48C | |||
| Core I7 920 2.66 GHz Stock Voltage | 29C | 47C | |||
| Core I7 920 3.433 1.2 Vcore | 39C | 57C | |||
After a BIOS revision we got from Intel, temperatures were reasonable on the Core I7 series. Previous to that we believe that the programs we were using to read temperatures were wrong. The BIOS fix brought that right up to snuff and using Core Temp, Speed Fan, HWinfo32, and CPUID HWinfo to verify temps we were satisfied that they were reading correctly. To get those temps we used the same method as when we got maximum voltages.
Overclocking
We’d have to say that Core I7 was the easiest CPU we’ve ever overclocked. In most cases with the 965 Extreme we just upped the multiplier and cranked up the CPU voltage by increments until we got a successful boot. Then Primed it and increased Vcore until it got stable, usually two notches above the successful boot.
We know you love overclocking so we’re going to give you all the overclocking numbers for the Core I7 CPU’s we tested.
Just how high did we push the Core I7 965 given our thermal limitations?
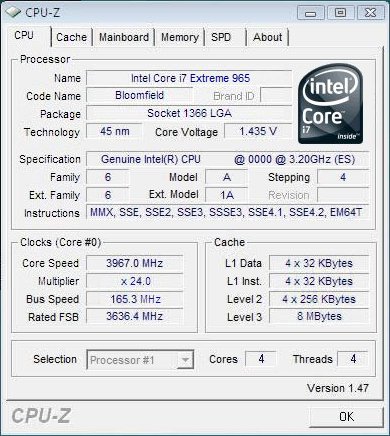
We were able to hit 3.967GHz with a FSB of 165 and a multiplier of 24 VCore 1.435. We were also able to hit 3.99GHz by upping the Multiplier to 30 and kicking the VCore to 1.275 leaving the FSB at 133 which seemed more reasonable to us. Unfortunately, at the time of posting, CPU-Z was freaking out and we got some really odd readings from it running the CPU that high.
The Core I7 940 we weren’t able to overclock because we had to Down Clock the I7 965 and OCing numbers on that would reflect the overclocking ability of the more expensive I7 965.
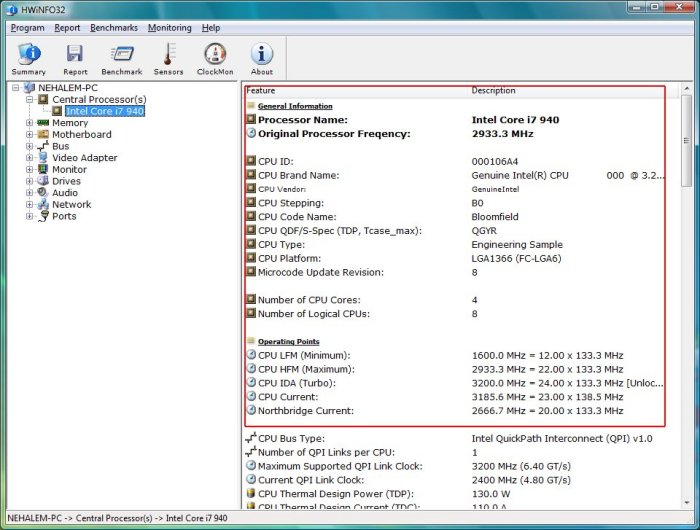
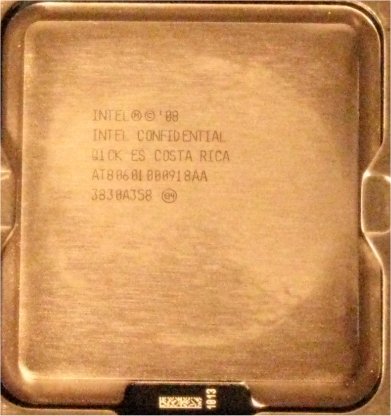
Even though HWiNFO32 is reading that as Core I7 940 we assure you it was indeed the Core I7 965 down clocked to 2.93GHz to simulate the Core I7 940 as per instructions from Intel.
We mentioned earlier that Core I7 would self overclock, notice there that we had it set to 2.93GHz, and it turboed to 3.185GHz all by itself. That feature is present on all the Core I7 CPU’s but on the Performance 940 and mainstream 920 model it will only turbo two bins up. (Two multipliers, say from 20 to 24, or 23 and up the FSB a hair or two), on the Core I7 965 we’re not sure how high it will turbo but if we get any updated info we’ll let you know. The fact that Intel is confidant enough to include that feature should tell you how stable an overclocker this series is.
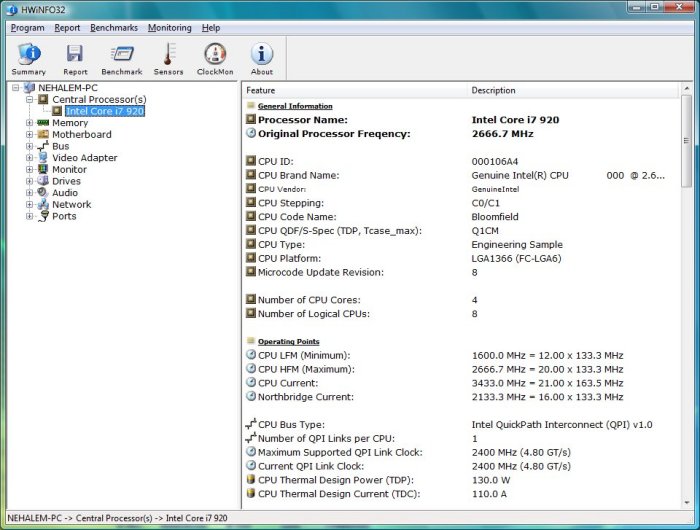
The Core I7 920 overclocked nicely from 2.66GHz to 3.433GHz with little to no effort. Will the Core I7 920 clock higher? You bet it will, we’ve seen it as high as 4GHz pushing 1.45 Vcore, is it safe to run it like that? It’s probably not safe to run the Core I7 920 at 1.45 Vcore, 45nm CPU’s aren’t known to be very tolerant to over volting. If you want to push it that high you’re going to need more than air cooling which is what we had available. The 3.433GHz was achieved with the Thermalright Ultra 120 RT which handled the Core I7 CPU’s quite nicely up to 3.86GHz on the 965, and 3.43GHz on the I7 920. With the stock cooler that comes with the I7 920, you’re probably good up to 2.8 GHz, so make sure and budget for some good cooling.
Goodies
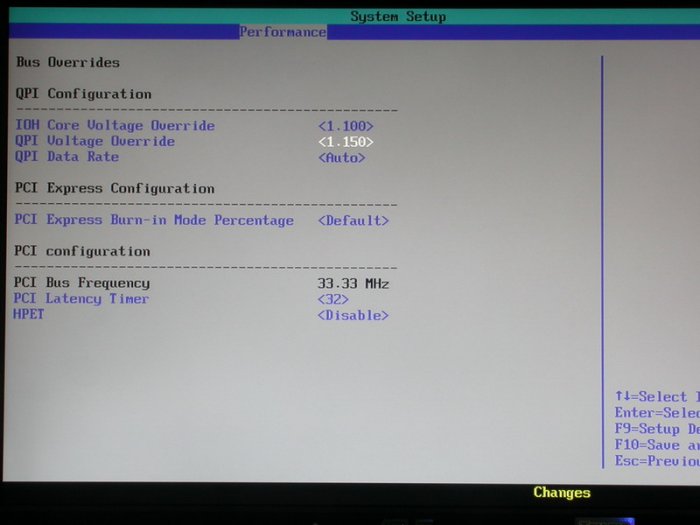
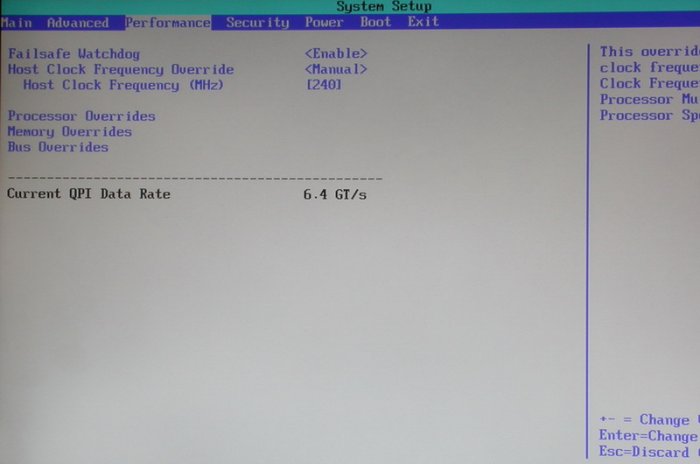
We thought we’d throw in a few screen shots of BIOS on the Intel DX58SO Smackover board. Keep in mind there are more screens than we’re showing and this is subject to change with BIOS revisions as this is a relitivly immature BIOS.
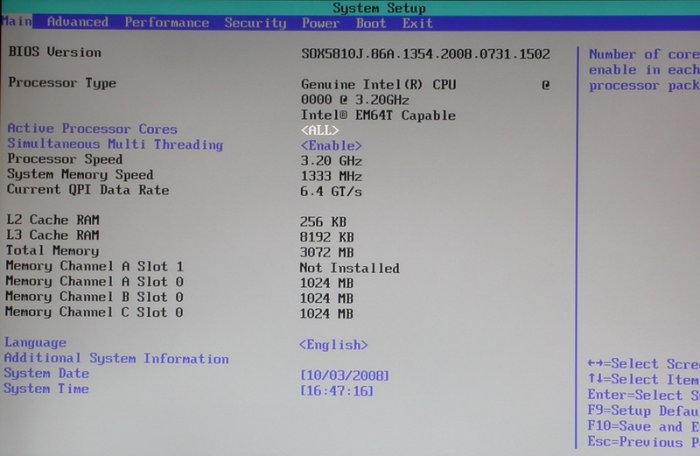
That’s advanced BIOS and it reflects the fact that we were able to (with some tinkering) OC the ram to 1333 and still remain under 1.6v on the ram. The Samsung Qimonda 3 Gig kit of triple channel ram we used was quite nice and OCed well from 1066 to 1333 with just a little tinkering.
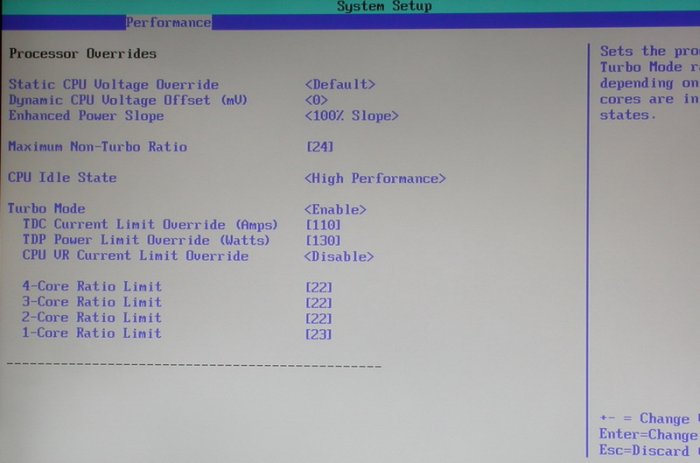
The Intel Smackover board handled overclcoking a little different than the other boards we have in hand at this time. It is an easy Overclocker though, the four numbers – 4,3, 2, and 1 Core Ratio Limit -just increase them to the multiplier you want on the 965 and increase the Dynamic CPU Voltage Offset and it clocks like a demon.
In that screen shot you can see the BIOS voltage over rides, if your driving a Core I7 940, or 920 you might need to tinker with those a little to OC, we didn’t need them to achieve 3.433GHz on the I7 920.
All we needed to do to reach 3.433GHz on the Core I7 920 was increase the FSB incrementally, bump the Dynamic CPU Voltage Offset a little at a time, and set a divider on the ram. After we reached the speed we wanted we ran prime 95 and were really surprised to find that after getting a successful boot into Windows Vista all we needed was a little voltage increase and we were entirely stable. That happened consistently every time. For a successful boot into Windows, bump the voltage once or twice and it’s complete stability.
CPU-Z
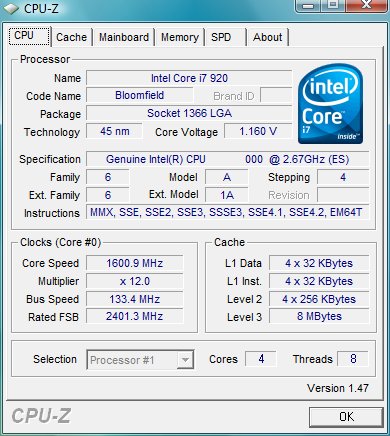
These days no review is complete without the CPU-Z story. As is the case with new technology, we can’t guarantee its accuracy as you can see from the first screen shot. We’re told CPU-Z is working on it at the time of posting. We wanted to let you see it, but take it for what it is. As far as we can tell, only the first screenie from CPU-Z is wrong, and it read the same no matter if we were using the Core I7 920 or I7 965.
CONCLUSION
The Core I7 940 Performance CPU is a solid performer. It’s more than a solid performer. Running at 2.93GHz it easily outperformed our Q6600 clocked to 3.6 GHz and the Q6600 was running much faster ram. Test after test it sent the Q6600 scurrying for cover. In order to give the Q6600 back a little of it’s self esteem we had to run a little SLI on it to give it an advantage. Even with it running 2 GPU’s, Core I7 940 still gave it a run with a single GPU, and in every Single GPU test put the Smackdown on the Q6600.
With the (vendor) price running at $562 for a 1000 units, it’s a little pricey for non-Enthusiasts. However, for that $562 (plus markup), they will get one of the fastest, easiest to overclock CPU’s on the planet. At this time, it’s only bested by the Core I7 965 with it’s unlocked multiplier (Vendor price $999). We saw blazing speeds in synthetic benchmarks and real life applications as well. Video encoding was blazing fast by previous standards and at every juncture we were very impressed with its performance.
Overclocking the Core I7 series was so easy we almost felt cheated of the elation we get from a good stable OC. Reaching 4GHz with the mainstream Core I7 920 convinced us it’s big brother Core I7 940 would be a classic overclocker. Overclocking this series was a pleasure and yielded significant performance gains.
Pros:
+ Great Performance
+ Overclocks Really Well
+ Kicked the Q6600 To The Curb
+ Reasonable Temps
+ Very Stable
+ Easy OCing
+ Much Higher Video Encoding Performance Than Previous CPU’s
Cons:
–Price
The Intel Core I7 940 is an amazing processor! There’s really no comparison to previous generations of CPU’s; let’s just say we’ve emerged from the Stone Age of computing. DDR3 has reached its hayday with the Core I7 IMC (Integrated Memory Controller) driving it. It even overclocks itself. How much more could you want?
Final Score: 9 out of 10 and the Bjorn3D Golden Bear Award.