Intels Q9400 is a LGA 775 CPU that runs at 2.66 GHz and falls in the affordable CPU range. The LGA 775 has a wide user base and it’s nice to see new lower voltage chips appearing.
INTRODUCTION
The Q9400 has been around for a while but amazingly we searched the web for reviews on it and just didn’t find anything significant. Just the odd user review without any formal testing or review. Since the economy took a nosedive and a lot of people are hanging on to the 775 LGA platform which still has a lot of life in it we thought it’d be a good idea to review the Q9400. Still retaining the Double Cheeseburger design (2 dual core CPU’s on one die) that we fell in love with on the Q6600 it runs at 2.66 GHz and promises to have the same overclocking capabilities as the Q6600. Consuming less voltage than it’s older brother the Q6600 and having a 266 MHz advantage on the older chip might give it an edge. The Q6600 has 8 MB L2 cache and the Q9400 has 6 MB L2 cache so we suspect it’ll be a close race. The older Q6600 has a FSB speed of 1066 and the Q9400 has a FSB of 1333 so it’s give and take on the specifications of the pair. The Q6600’s reputation of being a champion overclocker and it’s current low cost will be hard factors for the Q9400 to overcome. As most veteran overclockers know the multiplier has a lot to do with the overclocking potential of a given processor. The Q9400 has a multiplier of 8 and the Q6600 has a 9 multiplier so to reach the same OC speed you’ll need a higher FSB to overcome the lower multiplier on the Q9400 and that means picking the companion motherboard carefully. We believe we’re up to the challenge and the highest we’ve managed on our G0 stepping Q6600 is 3.8 and run it day to day at 3.6. Reaching 3.8 was a bit of a stretch on the Q6600, voltages and temperatures were a little high for our liking. With it’s 45nm design and 95w TDP the Q9400 promises to run cooler with lower voltage. If what we’ve seen in the past is any indicator of current CPU performance, lower volts with a smaller die design indicates better overclocking potential. Stick around and see if the Q6600 can retain it’s Overclocking crown or if the new kid on the block the Q9400 can don the royal robes.
About Intel
Intel pushes the boundaries of innovation so our work can make people’s lives more exciting, fulfilling, and manageable. And our work never stops. We never stop looking for the next leap ahead—in technology, education, culture, manufacturing, and social responsibility. And we never stop striving to deliver solutions with greater benefits for everyone.
It began with the Intel® microprocessor, the invention that sparked a revolution. Intel’s history of developing groundbreaking technology continues today. We attract the most brilliant minds in science to push the boundaries of innovation and further our position as the world’s leader in semiconductor technology. Our passion is to create technology that changes the world.
SPECIFICATIONS
The Q9400 was released without a lot of the fanfare that you get with the release of a new processor line so there’s not a lot of fancy beauty shots, or extended PR information. That being the case we pulled the information that was available from the Intel Website.
|
Core 2 Duo & Quad Specs |
|||
| Processor | Intel core 2 Duo e8400 | Intel core 2 Quad q9400 | Intel core 2 Quad q6600 |
| Technical process | 45 nm | 45 nm | 65 nm |
| Code name | Wolfdale | Yorkfield | Kentsfield |
| Default frequency | 3.0 GHz | 2.66 GHz | 2.4 GHz |
| Bus Frequency | 1333 MHz | 1333 MHz | 1066 MHz |
| Number of cores | 2 | 4 | 4 |
| Multiplier | 9 | 8 | 9 |
| L2 Cache | 6 MB. | 6 MB. (2x3Mb) | 8 MB. (2x4Mb) |
| VID | 0.85V-1.3625V | 0.85V-1.3625V | 0.85V-1.5V |
| TDP | 65 W | 95 W | 105 W |
While we are reviewing the Q9400 we wanted to include the specifications of two of the processors we have on the chartsso you can see how close in specifications they really are. From the looks of it the Q9400 shares a common linage with the E8400. The multiplier dropped to 8 to reflect the 2.66 GHz speed Intel wanted for the Q9400 and split the cache between the two dual core CPU’s on one die but other than that they are very simular. Notice the TDP on the Q9400 is 10 W less than the Q6600 and the maximum safe operating voltage on the Q9400 is 1.3625v which is .1375 less than the Q6600 but is identical to the E8400. Given the known overclocking capibilities of the E8400 and the Q6600 we’d bet our bottom dollar that the Q9400 is going to be in the same class of overclockers as it’s two not so distant cousins.
Features
- Quad Core
- Enhanced Intel Speedstep® Technology
- Intel® EM64T 1
- Intel® Virtualization Technology
- Enhanced Halt State (C1E)
- Execute Disable Bit 2
- Intel® Thermal Monitor 2
- Intel® Trusted Execution Technology (Intel® TXT) enabled
- PROCHOT# enabled
- THERMTRIP# enabled
- PECI enabled
- Extended Stop Grant State (C2E) enabled
- Deep Sleep State (C3E) enabled
- Deeper Sleep State (C4E) enabled
PICTURES & IMPRESSIONS
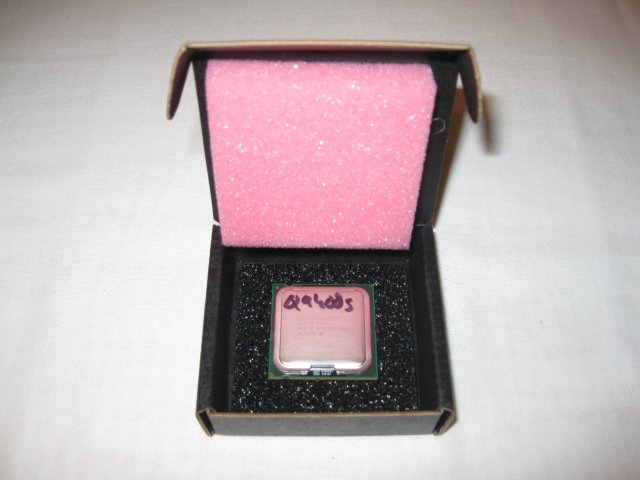
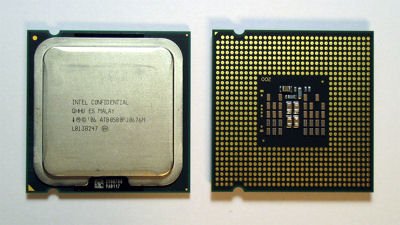
The Q9400 was delivered in a plain but protective black box sandwiched between a couple of layers of protective foam. Someone at Intel must need some reading glasses because our Q9400 came marked in permanent marker. Never fear though we dug up a few shots of the processor without the graffiti.
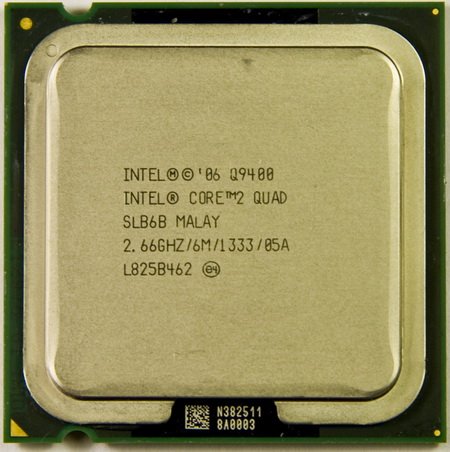
Processors aren’t real conducive to beauty shots, other than lettering they all tend to look a lot alike and to date we’ve yet to find any with LED’s, designer colors or chromed out finishes. We do think that a chromed out IHS that’s been factory lapped would be a nice addition but we’d settle for a factory lapped polished IHS and feel that the enthusiast community would embrace a limited line of those as they offer better heat dispersion and would prevent those happy little lapping accidents. (Like voiding the warranty)
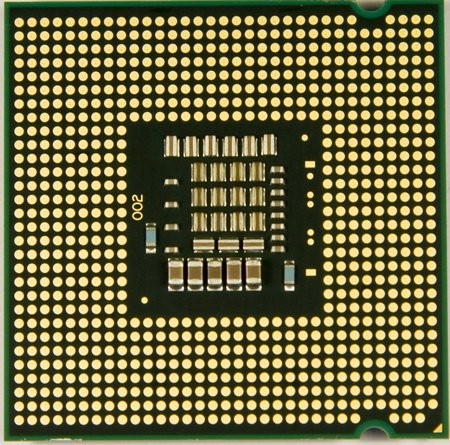
The back of the Q9400 is a grid of LGA pin receptors and a clustering of cache chips. Ours is stamped “002” so we’re pretty sure it has a license to kill. We got the CPU OCed and tried to shoot a picture and the results were pretty interesting so we thought we’d share it with you.

We were shooting over the edge of the Monitor and low and behold were pretty sure the camera captured some ethereal flames. We’re hoping that’s a good omen for the overclocking potential of the Q9400.
TESTING & METHODOLOGY
To test the Q9400 we ran the same hardware we used on the Core i7 965 as much as we could. Of course we had to go with a different motherboard (EVGA 790i) and for the ram we went with a Dual Channel DDR3 1600 kit. Since the 790i offers a nice high FSB and the ability to link and unlink the ram it offers the perfect platform for isolating the CPU from the ram and overclocking it without having to worry about the ram affecting the delicate overclocking operation. Meaning we can overclock to our hearts content without having to worry about the ram throwing a monkey wrench into the fun. It also means we can see the operation of the Q9400 overclocked with the ram isolated to 1600 because the ram can operate at it’s stock speed isolating and performance gains we see to the CPU itself.
We ran our normal suite of tests both stock speed and OC speed because we feel that just showing a CPU-Z screen shot of the OC is a little lame. Anyone can get into Vista long enough to pop a screen shot of an unstable OC and brag about the massive OC they achieved. We’re not anyone, we clocked that puppy as high as the equipment would allow and benched it then clocked it a little more. That way you get to see the average of 3 passes at the bench, and the OC gain you get from cranking the CPU up. That pretty much lets you know that the CPU was stable at that OC and not just some wimpy screen shot at the end of some highly unstable but bootable OC. Those of you from other sites scoping out our review of the Q9400, you know who you are. Shame on you OC it and drive it like you own it and bench it overclocked or stay on the porch with the little dogs. (That would be the arf arf of the toy dog variety as opposed to the Woof Woof of the Bjorn3D big dog variety, we are of course kidding in a good natured way)
Test Rig
| Test Rig “Quadzilla” |
|
| Case Type | Top Deck Testing Station |
| CPU | Q9400 |
| Motherboard | EVGA 790i Ultra SLI |
| RAM | Kingston HyperX DC DDR3 1600 4 GB Kit Cas 8 |
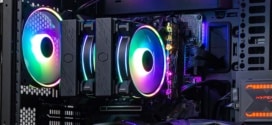
| CPU Cooler | Thermalright Ultra 120 (Dual 120mm Fans) |
| Hard Drives | Intel 80 GB SSD (MLC) |
| Optical | Sony DVD R/W |
| GPU(s) | BFG GTX-260 Maxcore |
| Case Fans | 120mm Fan cooling the mosfet CPU area |
| Docking Stations | None |
| Testing PSU | Thermaltake Toughpower 1200 Watt |
| Legacy | None |
| Mouse | Razer Lachesis |
| Keyboard | Razer Lycosa |
| Gaming Ear Buds |
Razer Moray |
| Speakers | None |
| Any Attempt Copy This System Configuration May Lead to Bankruptcy |
|
Test Suite
|
Synthetic Benchmarks |
|
3DMark Vantage v. 1.01 |
|
3DMark06 v. 1.1.0 |
|
SiSoft SANDRA XII Professional SP2 |
|
Everest Ultimate Edition v. 5.0 |
|
SuperPi Mod 1.5XS |
|
Cinebench R10 64 bit |
|
WinRar v. 3.71 |
We ran each test a total of 3 times (some more than three but at least 3) and report the average of those test runs here. If we did by chance get any seriously anomalous readings we tossed them out the window rechecked the hardware configuration and BIOS settings and reran the test. We also drove the Q9400 for a couple of weeks and got a feel for it in real life applications and day to day operation. While we provide the results of the Core i7 965 in the charts the Q9400 is from the LGA 775 family and the i7 965 is from the LGA 1366 family and the i7 results are there for comparison purposes only. Comparing two such different generations of processors is a little fruitless and comparing a $229.95 CPU (Current Q9400 pricing) to a CPU that runs close to $1000 is a little untenable. Like we mentioned for informational purposes only. We firmly believe that processors with similar price points and speeds are comparable but comparisons should be limited to that scope. While a Q9400 and decent OCer board can be had for around $400 an i7 965 and decent OCer board will set you back about $1300 so we feel justified in separating the comparison.
3DMark 06

3DMark06 developed by Futuremark, is a synthetic benchmark used for universal testing of all graphics solutions. 3DMark06 features HDR rendering, complex HDR post processing, dynamic soft shadows for all objects, water shader with HDR refraction, HDR reflection, depth fog and Gerstner wave functions, realistic sky model with cloud blending, and approximately 5.4 million triangles and 8.8 million vertices; to name just a few. The measurement unit “3DMark” is intended to give a normalized mean for comparing different GPU/VPUs. It has been accepted as both a standard and a mandatory benchmark throughout the gaming world for measuring performance.

We generally report the best 3DMark 06 score we got in a variety of runs, yes that means that if you stick the CPU in the board and run it stock you’ll get a lower score with the BFG GTX-260 Maxcore we’ve been using for testing. These are scores from the highly overclocked CPU’s and representative of the best score from an OCed CPU with the GPU running at stock speeds. As you can see the Q9400 runs right up there with the best of them when it comes to testing in 06. Results with multiple GPU setups might vary between it and the LGA 1366 family but for single GPU operation which is the bulk of the market there’s no disadvantage to running the Q9400 and with just a few shy points between it and the i7 965 a lot of advantages.
3DMark Vantage

For complete information on 3DMark Vantage Please follow this Link: www.futuremark.com/benchmarks/3dmarkvantage/features/
The newest video benchmark from the gang at Futuremark. This utility is still a synthetic benchmark, but one that more closely reflects real world gaming performance. While it is not a perfect replacement for actual game benchmarks, it has its uses. We tested our cards at the ‘Performance’ setting.
Currently, there is a lot of controversy surrounding NVIDIA’s use of a PhysX driver for its 9800 GTX and GTX 200 series cards, thereby putting the ATI brand at a disadvantage. Whereby installing the PyhsX driver, 3DMark Vantage uses the GPU to perform PhysX calculations during a CPU test, and this is where things get a bit gray. If you look at the Driver Approval Policy for 3DMark Vantage it states; “Based on the specification and design of the CPU tests, GPU make, type or driver version may not have a significant effect on the results of either of the CPU tests as indicated in Section 7.3 of the 3DMark Vantage specification and white paper.” Did NVIDIA cheat by having the GPU handle the PhysX calculations or are they perfectly within their right since they own Ageia and all their IP? I think this point will quickly become moot once Futuremark releases an update to the test.
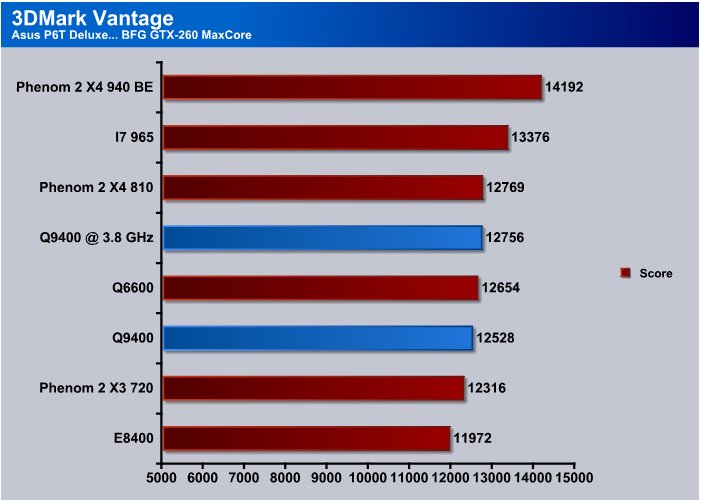
We got a pretty good score from the Q9400/BFG GTX-260 combination in Vantage but the older Q6600 came out a hair in the lead in this test. We ran the Q6600 on the Evga 790i with the same kit of ram so it’s a pretty level playing field.
Cinebench
“CINEBENCH is a real-world test suite that assesses your computer’s performance capabilities. MAXON CINEBENCH is based on MAXON’s award-winning animation software, CINEMA 4D, which is used extensively by studios and production houses worldwide for 3D content creation. MAXON software has been used in blockbuster movies such as Spider-Man, Star Wars, The Chronicles of Narnia and many more. MAXON CINEBENCH runs several tests on your computer to measure the performance of the main processor and the graphics card under real world circumstances. The benchmark application makes use of up to 16 CPUs or CPU cores and is available for Windows (32-bit and 64-Bit) and Macintosh (PPC and Intel-based). The resulting values among different operating systems are 100% comparable and therefore very useful with regard to purchasing decision-making. It can also be used as a marketing tool for hardware vendors or simply to compare hardware among colleagues or friends.”
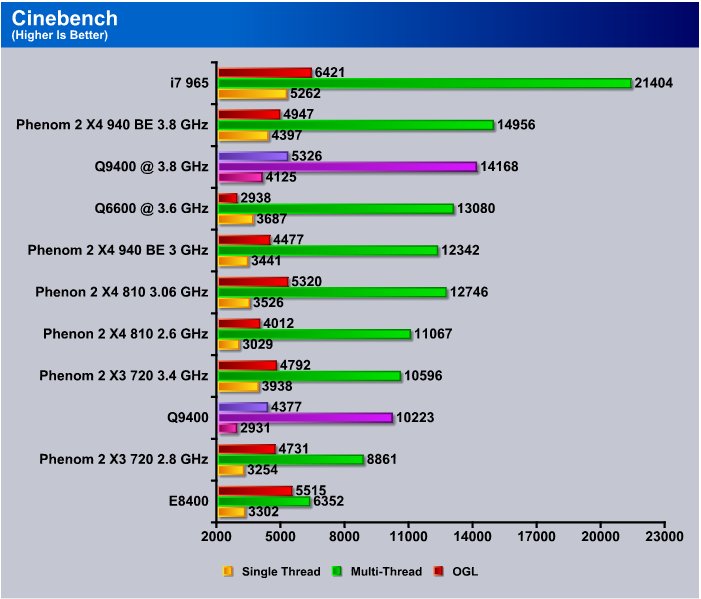
The Q9400 started out a little low in the standing at stock speed but we all know that’s not where they shine. They shine when you put the OC to them and watch them take off. We cranked that puppy up to 3.8 GHz easily, insanely easily but we’ll leave that tidbit for a little later. Once we put the overclocking hogleg to it and achieved 3.8 GHz stable we saw the Q9400 in the top 3 of the CPU’s we’ve tested and that’s pretty darn good for a CPU that retails (current pricing) for $229.95 at several etailers.
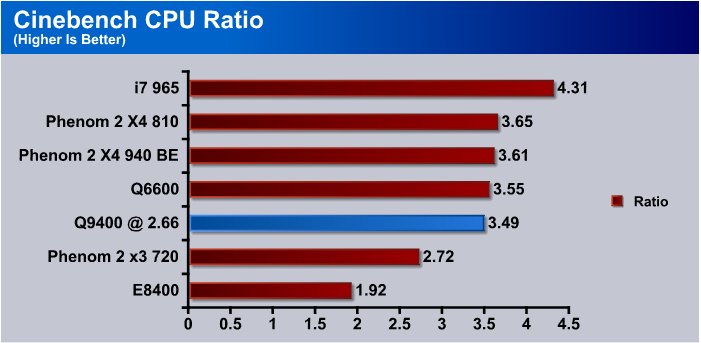
CPU Ratio is taking the total performance of the Quad and dividing it by the performance of a single core. It gives you a peek at how the cores cooperate and how efficient they are at working together. Running the Q9400 we see that we’re getting 3.49 for a ratio which means that compared to a single core CPU we’re getting almost 3 1/2 times the performance. Heavily threaded applications will get the most advantage from this aspect of a Quad. Applications with outdated programmers, err program code that use single or dual core threading won’t get as much advantage.
WinRar v. 3.71
This module in WinRar generates random data, which contains specially introduced redundancy, increasing the load to both the processor and memory. Data is then passed through RAR compression and decompression algorithms, and the output of the decompression algorithm is compared to the source data. If any differences are found, WinRar then reports “Errors found – Yes” in the command window. WinRar displays a size of processed data and compression speed, current and resulting, in kilobytes per second.

WinRar is a little bit of a strange creature when it comes to OCing, you get a little performance boost but not as much as you think you should. Again we’re seeing the Q9400 coming in third overall and second in comparable platforms. Again that’s pretty sweet for what is now considered an “Affordable” CPU.
Sisoft Sandra 2009 SP2
“SiSoftware Sandra (the System ANalyser, Diagnostic and Reporting Assistant) is an information & diagnostic utility. It should provide most of the information (including undocumented) you need to know about your hardware, software and other devices whether hardware or software. It works along the lines of other Windows utilities, however it tries to go beyond them and show you more of what’s really going on. Giving the user the ability to draw comparisons at both a high and low-level. You can get information about the CPU, chipset, video adapter, ports, printers, sound card, memory, network, Windows internals, AGP, PCI, PCI-X, PCIe (PCI Express), database, USB, USB2, 1394/Firewire, etc.”

The Q9400 handled the DDR3 a little better than the Q6600 but it’s LGA 775 and doesn’t have the advantage of an Integrated Memory controller like AMD or the i7 platform. Still of the LGA 775 we had it topped that class and from what we’ve seen with LGA 775 in most cases topping AM2(+) performance how much difference does it really make.
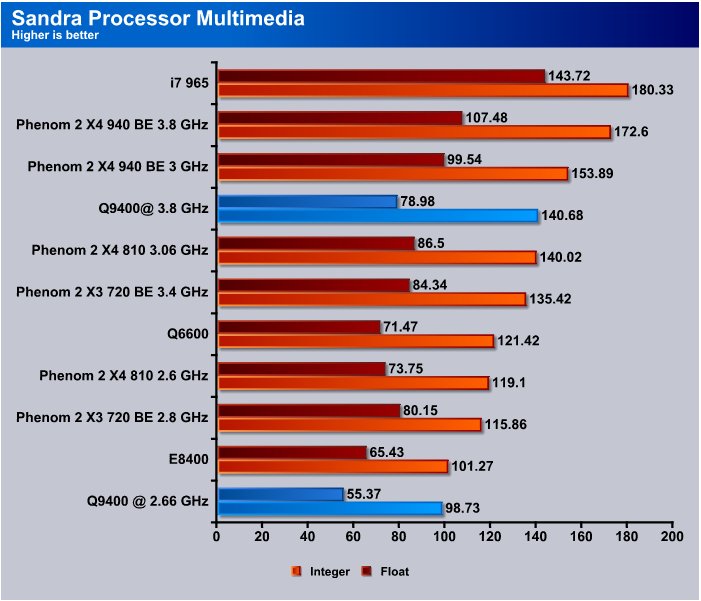
We bottomed out he chart in multimedia with the Q9400, keep in mind though that all the testing we did with the Q6600 has it running at 3.6 GHz and when we crank the Q9400 up to the top speed we tested at 3.8 GHz it leapfrogs the Q6600 and again comes in second place from the comparable CPU’s. Third overall. We can already hear the question forming in your head, is 3.8 to top speed we hit, no it’s not but we’ll leave that for a little later.
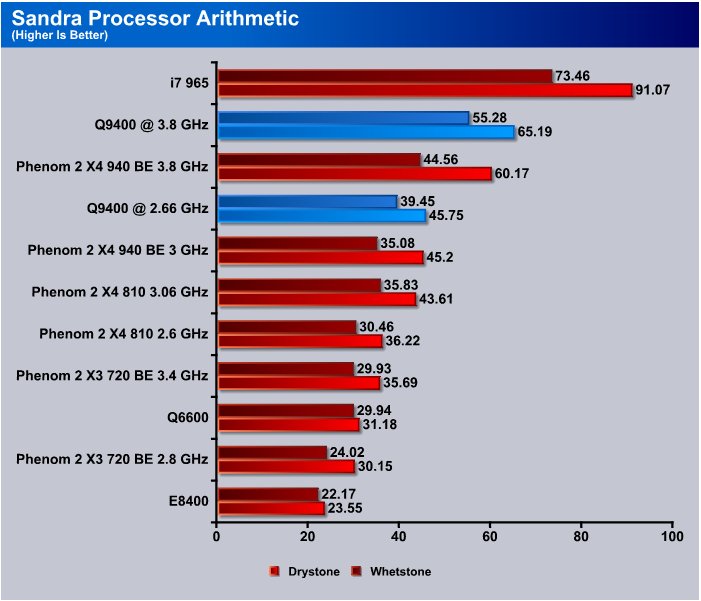
Processors spend a lot of time doing mathematical operations whether it be in real life applications or gaming so we put a lot of stock in the Processor arithmetic test in Sandra. The Q9400 seems to excel at math, even stock clocks produced some amazing results. They got even more amazing when we clocked it up to 3.8 GHz and it placed first in class. Not bad for a locked multiplier CPU with an 8 multiplier. We can tell you that compared to the Q6600 which is still a really nice processor that the Q8400 boots so fast it’s hard to catch the screen where you hit the delete key to access BIOS and even though we were paying close attention we missed hitting the key in time on several occasions. That wasn’t the case with the Q6600 which seemed to take a little more time to get into Vista. Running both CPU’s at stock was enlightening, we noticed the system was more responsive with the Q9400 even thought the 266 MHz advantage the Q9400 has is minimal it seemed to make a significant difference.
EVEREST ULTIMATE 5.0
EVEREST CPU
“EVEREST Ultimate Edition is an industry leading system diagnostics and benchmarking solution for enthusiasts PC users, based on the award-winning EVEREST Technology. During system optimizations and tweaking it provides essential system and overclock information, advanced hardware monitoring and diagnostics capabilities to check the effects of the applied settings. CPU, FPU and memory benchmarks are available to measure the actual system performance and compare it to previous states or other systems. Furthermore, complete software, operating system and security information makes EVEREST Ultimate Edition a comprehensive system diagnostics tool that offers a total of 100 pages of information about your PC.”
CPU AES
This integer benchmark measures CPU performance using AES (a.k.a. Rijndael) data encryption. It utilizes Vincent Rijmen, Antoon Bosselaers and Paulo Barreto’s public domain C code in ECB mode.
CPU AES test uses only the basic x86 instructions, the test consumes 48 MB memory, and it is Hyper Threading, multi-processor (SMP) and multi-core (CMP) aware.
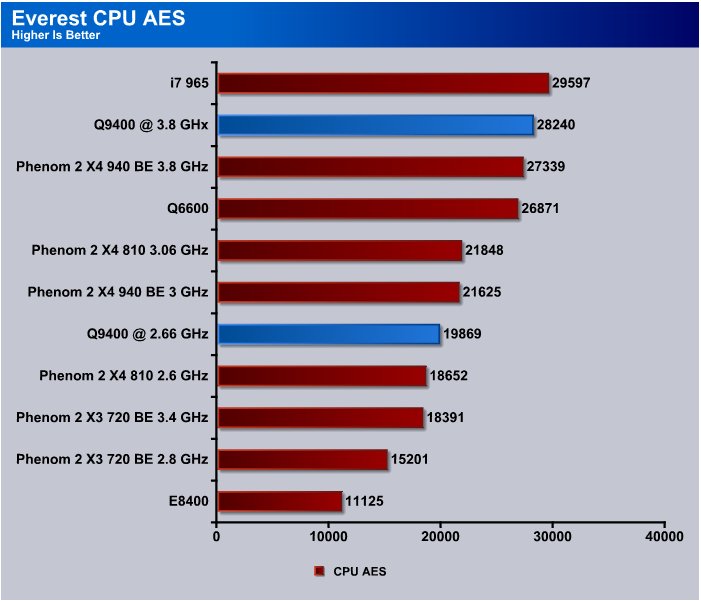
Here we are again sitting a little low in the chart at stock speed, then when we kick it overclock style we come out second overall. It’s amazing how much OC we can get from the chips these days. We’re glad to see that even if Intel doesn’t officially support overclocking their chips still do really well.
CPU PhotoWorxx
This integer benchmark performs different common tasks used during digital photo processing.
It performs the following tasks on a very large RGB image:
• Fill
• Flip
• Rotate90R (rotate 90 degrees CW)
• Rotate90L (rotate 90 degrees CCW)
• Random (fill the image with random colored pixels)
• RGB2BW (color to black & white conversion)
• Difference
• Crop
This benchmark stresses the integer arithmetic and multiplication execution units of the CPU and also the memory subsystem.
CPU PhotoWorxx test uses only the basic x86 instructions, and it is Hyper Threading, multi-processor (SMP) and multi-core (CMP) aware.
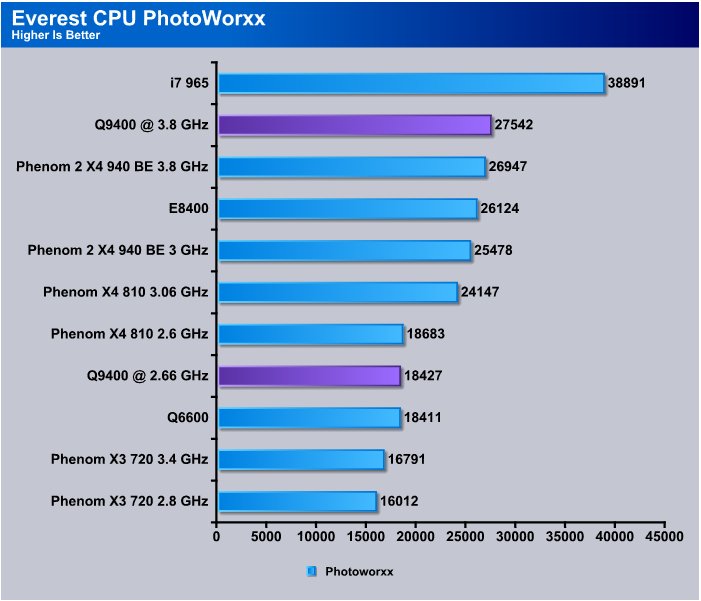
We see the same thing in photoworxx little low in the charts at stock and superstar overclocked. Photoworxx is known to like a good fast processor so it’s not a big surprise it did well in this test.
CPU Queen
This simple integer benchmark focuses on the branch prediction capabilities and the misprediction penalties of the CPU. It finds the solutions for the classic “Queens problem” on a 10 by 10 sized chessboard.
CPU Queen test uses integer MMX, SSE2 and SSSE3 optimizations. It consumes less than 1 MB system memory and it is Hyper Threading, multi-processor (SMP) and multi-core (CMP) aware.
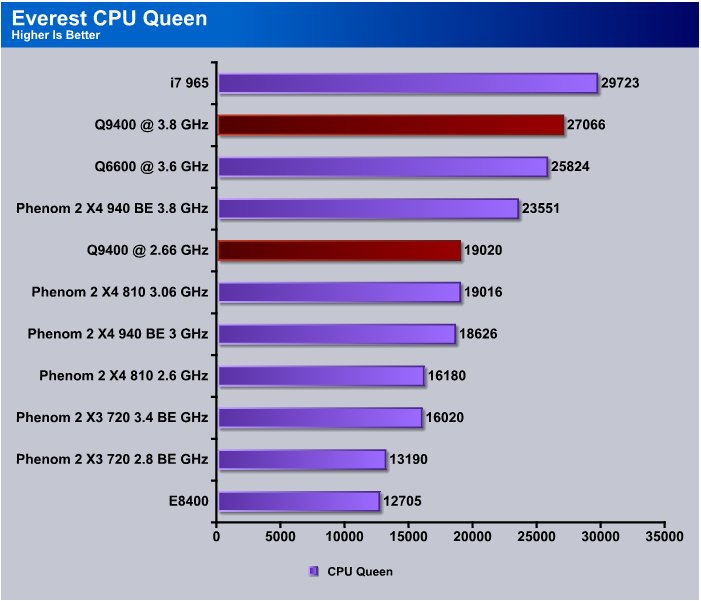
We’re seeing a pattern here in Everest, in CPU Quen we rose a few spots at stock speeds then overclock the Q9400 and it gets rockstar status. For a locked multiplier LGA 775 chip we really couldn’t be happier with it (Cough higher multiplier cough).
CPU ZLib
This integer benchmark measures combined CPU and memory subsystem performance through the public ZLib compression library Version 1.2.3 (http://www.zlib.net).
CPU ZLib test uses only the basic x86 instructions, and it is Hyper Threading, multi-processor (SMP) and multi-core (CMP) aware.

We dropped one spot overall in Zlib but considering it’s consistent performance in Everest CPU suite the Q9400 has more than held it’s own in the “Affordable Class” CPU’s.
Everest Memory

SOme of the tests in the Everest Memory Suite didn’t show any significant differences Stock or Overclocked, in those cases we just included a single result. That’s the disadvantage of using the 790i to hold the ram at a stable speed. The advantage is being able to point at the CPU and say all those gains are due to the CPU alone. We got a 59.5 ns latency on the Q9400/EVGA 790i/Kingston HyperX DDR3 DC 1600 kit.
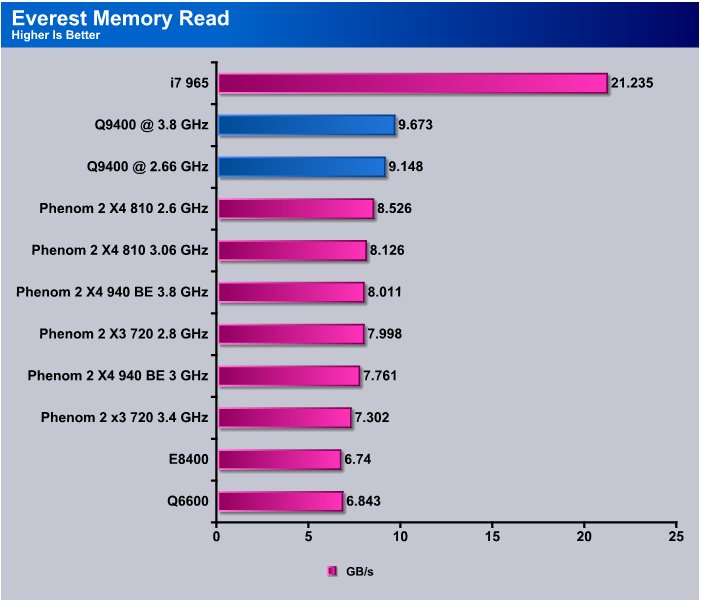
We did get a little performance boost out of the rig in the memory read test but it would have to be the CPU pushing data at the ram faster because the ram was held at 1600 the whole time. Most of the Phenom rigs were driving DDR2 in this test so it’s not unusual to see DDR3 getting a little edge.
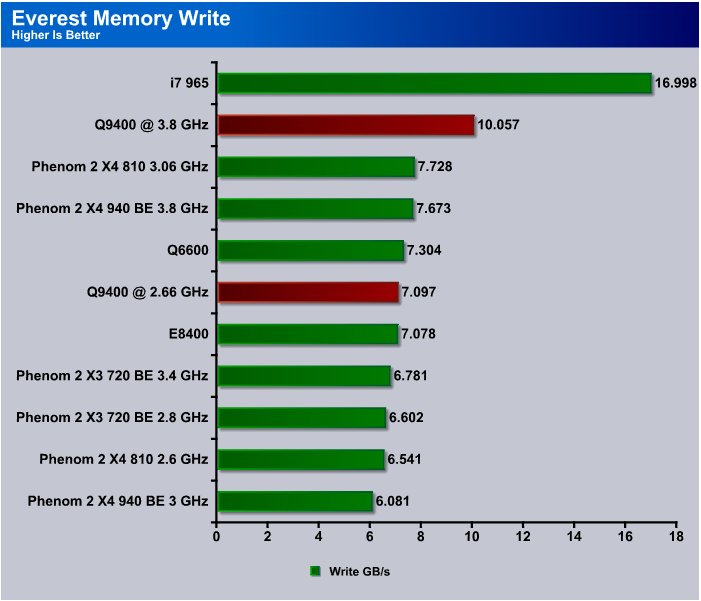
We saw the biggest difference in the Memory Write test jumping from just over 7 GB/s to 10 GB/s and we were a little shocked to see that so this is one of the tests we ran more than 3 times. We actually ran it about 10 times before we gave in and believed the results.
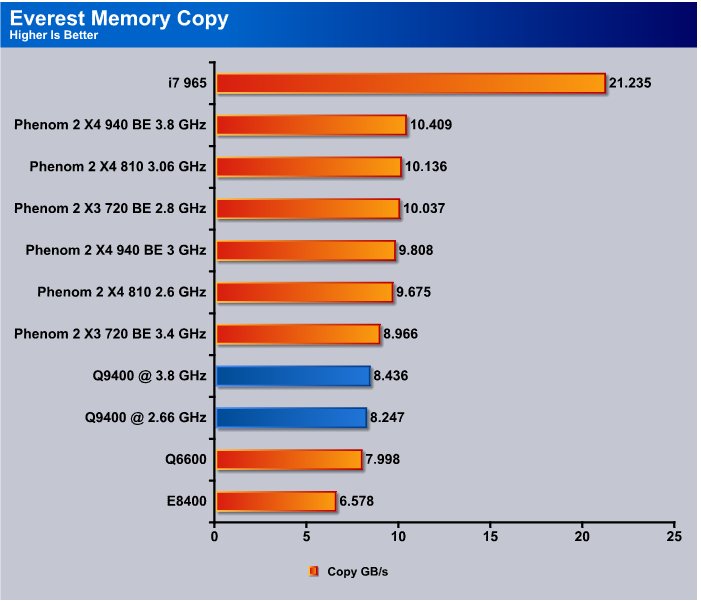
The memory copy test the Q9400/LGA 775/HyperX DDR3 1600 combination fell back down to 8 (ish) GB/s which isn’t a suprise, the LGA 775 platform always seems to slow down a little in the Everest Memory copy test. If we ever meet Everest we’ll have to ask him why. (Had ya going there that’s the name of the testing suite not the guy who wrote the code).
CPU-Z & OVERCLOCKING
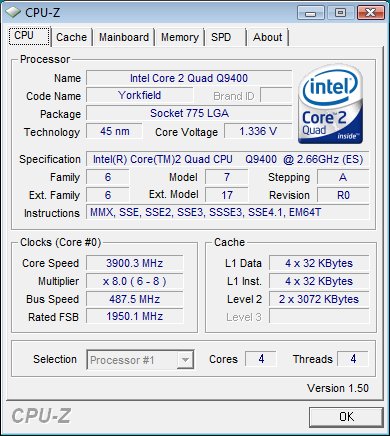
Lets start with the shots of CPU-Z 1.50 and the stock settings on the Q9400 and test rig.

You can see we’re using a Q9400 and it’s 45 nm stock votage read as 1.184 and that leaves us some nice overclocking headroom before we get to 1.3675.
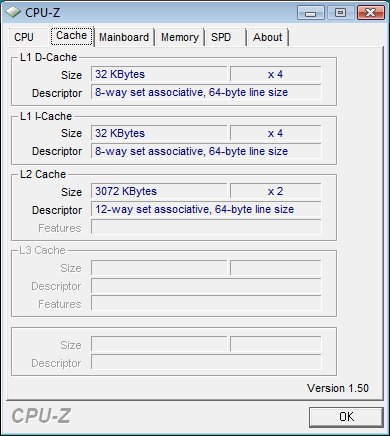
Cache shows 128 Kb L1 and L2 Cache and the 6 Mb L3 cache. No surprises here.
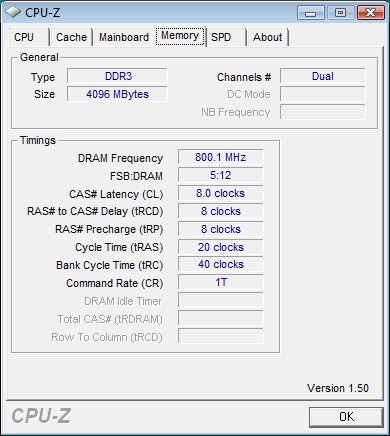
We have the DDR3 1600 kit at 1600 MHz at Cas 8 and running at 1T.
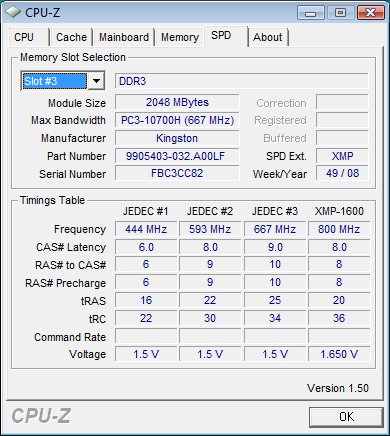
SPD we thought we’d throw that in so you could get a look at it but it doesn’t have much to do with the review.

Then finally you can see the 3.8 GHz we tested at. Reaching 3.8 GHz was insanely easy, we bumped the voltage up on the CPU, NB and FSB and started walking the CPU up to the speed we wanted. 3.8 was a snap and the Q9400 didn’t even hesitate at that. We got 3.8 GHz with a FSB of 475 and have run the Q9400 a little higher but were nearing the FSB wall on the EVGA 790i we have. Yea that’s right we got 3.8 GHz and did it under 1.3v (at least with vdroop) we still had a little wiggle room but we’re close to the point of diminishing returns. If you want to see the best OC we got turn the page. We saved that for the conclusion.
CONCLUSION
We’ve been looking at less expensive solutions to keeping performance up and costs down. It seems we’ve not only found a fairly affordable CPU in the Q9400 but also found a champion overclocker. We were amazed when we hit 3.8 and we hit 3.8 so easy it was almost a crime. Simply increasing the voltage on the processor and bumping the NB and FSB voltages on the EVGA 790i got up to 3.8 GHz in just a few short minutes. How many minutes you ask, we hit 3.8 GHz stable in under 30 minutes and went back and trimmed voltages a little which took another 30 minutes. Total overclock time about an hour. From 2.66 to 3.8 GHz in about an hour that’s some seriously easy overclocking. We ran Prime 95 for 4 hours and with the Titan Fenrir cpu cooler in a single fan configuration never saw temps over 66c which amazed us even farther. We had spare coolers and more fans close at hand but with it’s lower voltage requirements and 45nm design we didn’t need them. That always makes for a good day when you pick the right cooler out of the closet first time because we normally end up going through 3 or 4 to hit the maximum overclock. Sometimes we have to move to water cooling to realize the potential of a processor but the Q9400 gave enough to make us happy on air. More extreme cooling might yield better results.
Hitting the market at 229.95 (at the time of posting for the Q9400 non “s”) the Q9400 isn’t the fastest processor out there, but it’s also by far not the most expensive. We’d have liked a little higher CPU multiplier to see how far we could have pushed this overclocking champion. The farthest we could push the Q6600 with it’s 9 multiplier on the same board was 3.6 GHz and on another board we hit 3.8 but never hit 3.8 with great stability. We spent several days trying to stabilize the Q6600 and we got 3.8 stable on the Q9400 in about an hour. That goes a long way with us because in reviewing you spend a lot of time trying to reach that nirvana overclocking speed. We actually got higher than 3.8 GHz and touched 3.9 for long enough to run stability testing. We got 3.9 stable and it wasn’t very hard to do, it took about an additional 2 hours to hit 3.9 GHz unfortunately by that time we’d already done all our testing and the charts were built. Please take note that the CPU we reviewed is the lower power Q9400s and retails for about $320.00 (USD), all the Q9400 lineup should perform about the same with the only difference being the watt requirements on the CPU.
We were at what Intel is recommending safe limits for the Q9400 when we hit 3.9 GHz so you can see from the previous page that we went from 1.3v to 1.36v (in BIOS) and that’s pretty much the point of diminishing return on our chip. It’ll go higher but that’s pushing volts and we don’t encourage that. We’ve hit 4 GHz without pushing many more volts but in the interest of safe computing we’re not picturing or encouraging above Intel recommended safe voltage.
For a $229.95 CPU we’re liking the performance of the Q9400 (non “s” model $320 for the 65 Watt Q9400s), good price, overclocking champion that’s a winning combination. Any chip that costs that much and you can get a 50% overclock with a locked multiplier is good in our book. There’s more to get from the Q9400 it just depends on how bad you want bragging rights, you’ll need a high FSB capable motherboard and some nerves of steel mixed with a little overclocking skill but it’s there to get.
During the current economic downturn if your setting on a lesser Quad (or Intel Forbid, a Dual Core) the Q9400 makes sense performance and price wise. We’re going to retire our aging Q6600 for a little easier duty and run with the Q9400 until magic blue smoke do us part.
We are trying out a new addition to our scoring system to provide additional feedback beyond a flat score. Please note that the final score isn’t an aggregate average of the new rating system.
- Performance 9
- Value 9
- Quality 10
- Warranty 8
- Features 8
- Innovation 8
Pros:
+ Champion Overclocker
+ Good Price On the Q9400, You’ll pay a little more for the Q9400s but if you want to save power it normally costs more.
+ 45nm Design/Lower Voltage Requirements
+ Performance Above It Price Point
+ Easy To Overclock
+ Proven Double Cheeseburger Design
Cons:
– Locked Multiplier
– Need A High End Board for High FSB To Offset The 8x Multiplier
The Price/Performance punch we got from the Q9400 and it’s ability to Overclock from 2.66 to 3.9 GHz (50% and higher) along with it’s over all high performance and energy savings we score the Q9400 a: 8.5 out of 10 and the Bjorn3D Seal Of Approval.