Many users want a good combination of performance and cost. We are here today with the newest additions to the Athlon II family, which come in at a higher clock rate than their siblings. This should net some extra performance without breaking the bank.
Introduction
Many of us have been severely hit by the slacking economy, and have less money to spend on our computer upgrades. AMD is here to help with their Athlon II line of CPU’s. The Athlon II’s have the same great architecture (K10.5) as their Phenom II counterparts. This means the CPU will be able to process information just as fast as the Phenom II CPUs. The only major difference between the Athlon II and Phenom II lineup is the lack of L3 cache on the Athlon II CPUs. In the real world this proves to be a small advantage in the Phenom II’s favor, but the Athlon II is not far behind the Phenom II even with this disadvantage.
Earlier we took a look at the lower end CPUs in the Athlon II series, but today we will take a look at a couple of the more high end CPUs, the X3 440 and X4 635. The 440 checks in at 3 GHz clock speed, and the 635 comes in at 2.9 GHz. The 440’s clock speed actually comes in higher than the 720 BE, which is a tri-core (like the 440) with an unlocked multiplier. While the 720’s unlocked multiplier is nice for overclocking, the overall higher clock speed of the 440 will overpower the 720 if used at stock speeds. If you have no plans on overclocking this CPU it would be a smart idea to save some money with the 440 instead of going for the 720.
As for the 635, it comes in faster than the 810 and 925. The 635 should have a pretty sizable advantage over the 810 since its clock speed is a while 300 MHz faster. However it should end up being pretty close to the 925 because it is clocked only 100 MHz faster. As before, the 635 is a great option for someone who is not interested in overclocking yet wants to have plenty of performance. Though prices have not been announced yet, the 630 costs ~$113 USD, so the 635 should only be around $10-20 USD more putting it below below the 925, and far below the 810.
| CPU Name | Cores | Clock | L2/L3 Cache | HT Bus | Socket | TDP | Price |
| AMD Phenom II X4 965 BE | 4 | 3.4GHz | 2+6MB | 4000MHz | AM3 | 140W | $179 |
| AMD Phenom II X4 955 BE | 4 | 3.2GHz | 2+6MB | 4000MHz | AM3 | 125W | $165 |
| AMD Phenom II X4 945 | 4 | 3.0GHz | 2+6MB | 4000MHz | AM3 | 125W | $159 |
| AMD Phenom II X4 925 | 4 | 2.8GHz | 2+6MB | 4000MHz | AM3 | 95W | $139 |
| AMD Phenom II X4 910e | 4 | 2.6GHz | 2+6MB | 4000MHz | AM3 | 65W | $169 |
| AMD Phenom II X4 905e | 4 | 2.5GHz | 2+6MB | 4000MHz | AM3 | 65W | $175 |
| AMD Phenom II X4 810 | 4 | 2.6GHz | 2+4MB | 4000MHz | AM3 | 95W | $139 |
| AMD Phenom II X3 720BE | 3 | 2.8GHz | 1.5+6MB | 4000MHz | AM3 | 95W | $104 |
| AMD Phenom II X3 710 | 3 | 2.6GHz | 1.5+6MB | 4000MHz | AM3 | 95W | $99 |
| AMD Phenom II X3 705e | 3 | 2.5GHz | 1.5+6MB | 4000MHz | AM3 | 65W | $119 |
| AMD Phenom II X2 555 | 2 | 3.2GHz | 1+6MB | 4000MHz | AM3 | 80W | $99 |
| AMD Phenom II X2 550 | 2 | 3.1GHz | 1+6MB | 4000MHz | AM3 | 80W | $91 |
| AMD Athlon II X4 635 | 4 | 2.9GHz | 2MB | 4000MHz | AM3 | 95W | $120 |
| AMD Athlon II X4 630 | 4 | 2.8GHz | 2MB | 4000MHz | AM3 | 95W | $102 |
| AMD Athlon II X4 620 | 4 | 2.6GHz | 2MB | 4000MHz | AM3 | 95W | $99 |
| AMD Athlon II X3 440 | 3 | 3.0GHz | 1.5MB | 4000MHz | AM3 | 95W | $84 |
| AMD Athlon II X3 435 | 3 | 2.9GHz | 1.5MB | 4000MHz | AM3 | 95W | $75 |
| AMD Athlon II X3 425 | 3 | 2.7GHz | 1.5MB | 4000MHz | AM3 | 95W | $72 |
| AMD Athlon II X2 255 | 2 | 3.1GHz | 2MB | 4000MHz | AM3 | 65W | $75 |
| AMD Athlon II X2 250 | 2 | 3.0GHz | 2MB | 4000MHz | AM3 | 65W | $65 |
| AMD Athlon II X2 245 | 2 | 2.9GHz | 2MB | 4000MHz | AM3 | 65W | $61 |
| AMD Athlon II X2 240 | 2 | 2.8GHz | 2MB | 4000MHz | AM3 | 65W | $53 |
Features & Specifications
AMD Direct Connect Architecture
An award-winning technology designed to reduce bottlenecks that can exist when multiple components compete for access to the processor bus. Competing x86 systems use a single front-side bus (FSB) which must carry memory access, graphics, and I/O traffic. Eliminate the FSB, and you can reduce delays that competing access requests can cause.
45 nm Process Technology with Immersion Lithography
More efficient process technology with cutting-edge lithographic performance puts more transistors in less space.
AMD Wide Floating Point Accelerator
Doubles processor bandwidth from 64- to a full 128-Bit Floating-Point math processing pipeline that can double many of the bandwidth paths that help keep it full.
AMD Digital Media XPress™ 2.0 Technology
Provides support for SSE, SSE2, SSE3, SSE4a, and MMX instructions for digital media applications and security.
True Multi-Core Processing
The extensive AMD64 architectural optimizations and features enable thorough integration of multiple cores within the same processor, with each core having its own L1 and L2 caches.
AMD Dedicated Multi-Cache
Each core has its own dedicated L2 cache, which enables simultaneous independent core access to L2 cache, eliminating the need for cores to arbitrate for cache access. This helps reduce latency on L2 cache accesses.
AMD Virtualization™ (AMD-V™) Technology
Silicon feature-set enhancements designed to improve the performance, reliability, and security of both existing and future virtualization environments.
AMD PowerNow! 3.0 Technology
The latest power management technologies that deliver performance on demand when you need it, and power savings when you don’t.
HyperTransport™ 3.0 Technology
Third-generation HyperTransport™ interface improves performance, supporting transfer speeds up to 4.4GT/s.
Simultaneous 32-bit and 64-bit Computing
AMD64 technology enables a breakthrough approach to 64-bit computing that doubles the number of registers in the processor and allows PC users to use today’s 32-bit software applications while enabling them to also use the next generation of 64-bit applications.
Cool’n’Quiet™ 3.0 Technology
Up to eight different performance states help enhance power efficiency. Simplified performance state transitions can reduce latency and the software overhead of performance state changes.
AMD Dynamic Power Management
Each processor core, and the integrated memory controller and HyperTransport™ controller, is powered by dedicated voltage planes.
Integrated Dual-Channel Memory Controller
Directly connects the processor to memory for optimum performance, low latency, and high throughput.
Multi-Point Thermal Control
The next-generation design features multiple on-die thermal sensors with digital interface. Automatic reduction of p-state when temperature exceeds pre-defined limit. Additional memory thermal management interface.
AMD CoolCore™ Technology
Coarse and fine transistor control that can automatically reduce processor energy consumption by turning off unused parts of the processor.
| Specification | X3 425 | X3 440 | X4 620 | X4 635 |
|---|---|---|---|---|
| # of Cores |
3 |
3 | 4 | 4 |
| Clock (GHz) |
2.7 |
3 | 2.6 | 2.9 |
| L2 Cache (MB) |
512×3 |
512×3 | 512×4 | 512×4 |
| Process (nm) |
45 |
45 | 45 | 45 |
| HT Version |
3.0 |
3.0 | 3.0 | 3.0 |
| Memory Controler (# of channels) |
Dual |
Dual | Dual | Dual |
On paper these CPUs are all pretty closely related. In fact I would be willing to bet that the Athlon X3’s are just an X4 with a bad core. If you found a way to unlock the fourth core and where able to get the CPU to run stably you wouldn’t gain much since the prices between the tris and quads are pretty close (A difference of ~$35 between the 440 and 635 respectively). You are better off avoiding the tedious work of unlocking the CPU,and just spending to few extra bucks for a stable core.
Pictures & Impressions
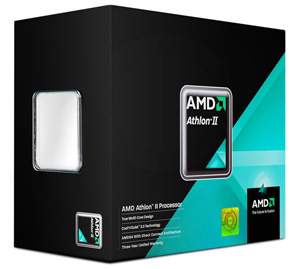
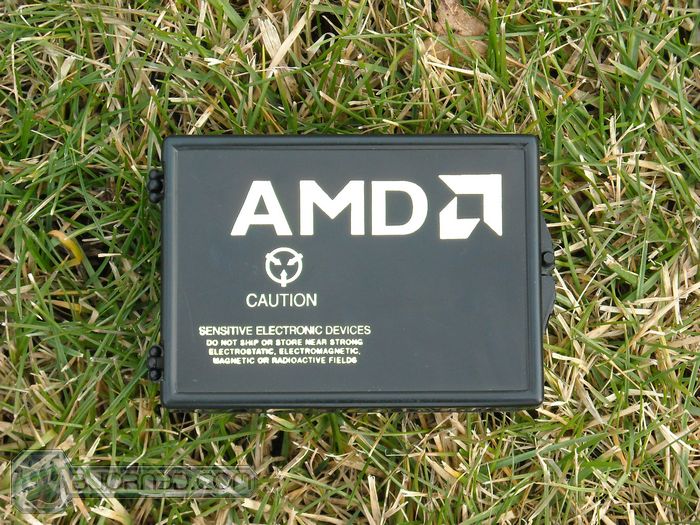
Since AMD does not send box’s with CPU’s we had to dig up this image of an actual box. Expect these CPUs to come in this box, but you’ll probably be surprised with the size. My X3 425 (Which I bought) has the smallest CPU box I have ever seen.

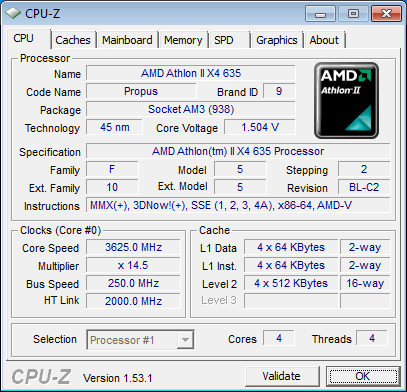
Here we have a nice shot of the CPU at an angle for your viewing pleasure. As with any AM3 CPU the CPUs look identical. The only distinguishing feature are the numbers on the top of the chip. Buried in this long line will be the name of the CPU, for example there is a 635 in the 635’s serial number. Now that we know the CPU is in fact a CPU and not some alien life form lets continue.
Metholdology
To test the CPUs we installed a fresh load of Windows 7 Ultimate 64 bit and applied all the patches and updates for the OS, then we updated all the motherboard drivers and made sure that we had the latest 9.12 Catalyst drivers. We do this so we ensure that we have a fresh load with no old drivers hanging around to bugger up our benchmark numbers.
We ran each test 3 times and averaged the results, the average of those results are reported here. Below is a detailed list of the components used during testing.
| Test Rig | |
| Case | Logisys Dracula |
| CPU | AMD Athlon II X3 425, 440, X4 620, 635 |
| Motherboard | Gigabyte GA-MA770 UD3 |
| Ram | (2x2GB) DDR3 @ 1600 9-9-9-20 |
| CPU Cooler | Cooler Master TX-3 |
| Hard Drives | Western Digital SE16 640 GB |
| Optical | LiteOn DVDR |
| GPU’s Tested |
Sapphire HD 5770 Vapor-X |
| Testing PSU | Corsair HX850 Watt |
Synthetic Benchmarks & Games
| Synthetic Benchmarks & Games | |
| Everest 5.0 | |
| Winrar 3.9 | |
| POV Ray | |
| Excel | |
| Blender | |
| Cinebench R10 | |
| Vantage | |
| SiSoft Sandra 2010 | |
Overclocking

To overclock the CPU’s I went into the motherboard BIOS and began raising the Bus speed. Since these are not Black Edition CPU’s you can not simply raise the multiplier. When you raise the Bus speed you also raise the RAM speed. This is a good thing if you are looking for more speed for your RAM, but this could lead to instabilities. As before we recommend you pick up a Black Edition CPU if you plan on overclocking, or at the very least an aftermarket cooler. Below are our result.
Lets start off with the X3 440. The chip is 3 GHz stock.

Unfortunately our 770 was not very happy with increasing the Bus on this chip. If you where to pick up a motherboard that is capable of a higher bus speed this frequency should be easily surpassed, but the 770 is not the motherboard to do it. An increase of 150 MHz should see a difference none the less. Now lets take a look at how the 635 faired.

As seen here the 635 fared a bit better. We still will blame the 770 for the small overclock. Perhaps if we had more time we would be able to reach a higher frequency with this motherboard, but for right now this is our highest result.
Update
Since writing this we were able to push the chip to a much higher result. We must say this is a great result. You can check out our AMD 890 GX review for bench numbers.
Everest Ultimate

“EVEREST Ultimate Edition is an industry leading system diagnostics and benchmarking solution for enthusiasts PC users, based on the award-winning EVEREST Technology. During system optimizations and tweaking it provides essential system and overclock information, advanced hardware monitoring and diagnostics capabilities to check the effects of the applied settings. CPU, FPU and memory benchmarks are available to measure the actual system performance and compare it to previous states or other systems. Furthermore, complete software, operating system and security information makes EVEREST Ultimate Edition a comprehensive system diagnostics tool that offers a total of 100 pages of information about your PC.”
CPU AES
This integer benchmark measures CPU performance using AES (a.k.a. Rijndael) data encryption. It utilizes Vincent Rijmen, Antoon Bosselaers and Paulo Barreto’s public domain C code in ECB mode.
CPU AES test uses only the basic x86 instructions, the test consumes 48 MB memory, and it is Hyper Threading, multi-processor (SMP) and multi-core (CMP) aware.
CPU PhotoWorxx
This integer benchmark performs different common tasks used during digital photo processing.
It performs the following tasks on a very large RGB image:
• Fill
• Flip
• Rotate90R (rotate 90 degrees CW)
• Rotate90L (rotate 90 degrees CCW)
• Random (fill the image with random colored pixels)
• RGB2BW (color to black & white conversion)
• Difference
• Crop
This benchmark stresses the integer arithmetic and multiplication execution units of the CPU and also the memory subsystem.
CPU PhotoWorxx test uses only the basic x86 instructions, and it is Hyper Threading, multi-processor (SMP) and multi-core (CMP) aware.
CPU Queen
This simple integer benchmark focuses on the branch prediction capabilities and the misprediction penalties of the CPU. It finds the solutions for the classic “Queens problem” on a 10 by 10 sized chessboard.
CPU Queen test uses integer MMX, SSE2 and SSSE3 optimizations. It consumes less than 1 MB system memory and it is Hyper Threading, multi-processor (SMP) and multi-core (CMP) aware.
CPU Zlib
This integer benchmark measures combined CPU and memory subsystem performance through the public ZLib compression library Version 1.2.3 (http://www.zlib.net).
CPU ZLib test uses only the basic x86 instructions, and it is Hyper Threading, multi-processor (SMP) and multi-core (CMP) aware.
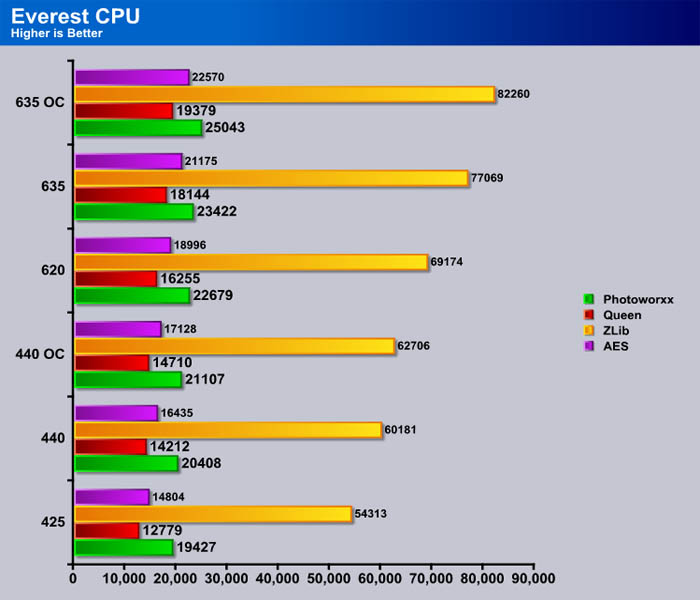
Surprisingly the chart goes up in order of a sort of “CPU ranking” hierarchy. The overclocked 440 proves to be no match for the 620 despite the 620 being clocked lower. Its no surprise that the 635 was easily the king of the charts in this test. When you apply the OC its lead only grows.
Memory Tests

Here we see a more spread out picture. The higher bus speed helps both overclocked CPUs. This is because it has also sped up the RAM, thus providing a sort of unfair advantage to the overclocked CPUs. The quads and tri cores both scored around the same, this is because the memory controller is the same. There is not much benefit to having a higher clock speed when the RAM is at a set speed.
WinRar v. 3.9

This module in WinRar generates random data, which contains specially introduced redundancy, increasing the load to both the processor and memory. Data is then passed through RAR compression and decompression algorithms, and the output of the decompression algorithm is compared to the source data. If any differences are found, WinRar then reports “Errors found – Yes” in the command window. WinRar displays a size of processed data and compression speed, current and resulting, in kilobytes per second.
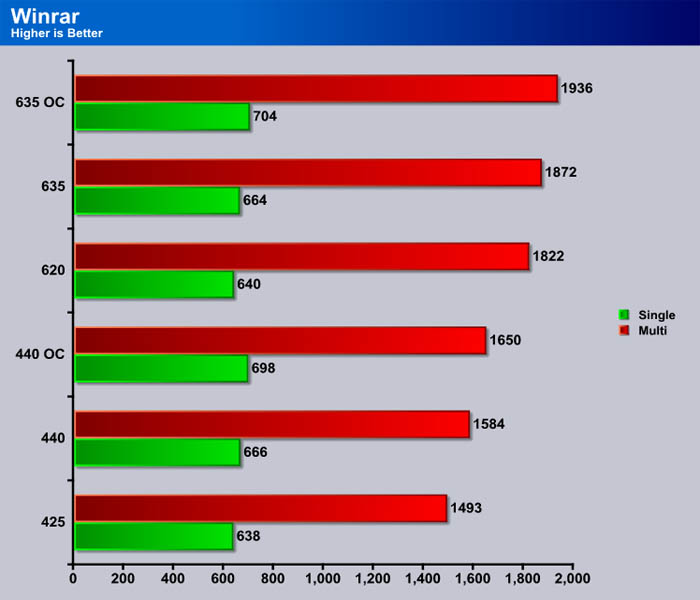
Again we see the scores go up by the CPU. The fourth core really makes a difference in this test. Despite having a 550 MHz clock disadvantage the 620 easily beat out the overclocked 440. However the difference between the CPU speeds with the same amount of cores is much closer. The 635 barely managed to beat out the 620 despite being 300 MHz faster.
POV-Ray 3.7 Beta 25

The Persistence of Vision Ray-Tracer was developed from DKBTrace 2.12 (written by David K. Buck and Aaron A. Collins) by a bunch of people (called the POV-Team) in their spare time. It is a high-quality, totally free tool for creating stunning three-dimensional graphics. It is available in official versions for Windows, Mac OS/Mac OS X and i86 Linux. The POV-Ray package includes detailed instructions on using the ray-tracer and creating scenes. Many stunning scenes are included with POV-Ray so you can start creating images immediately when you get the package. These scenes can be modified so you do not have to start from scratch. In addition to the pre-defined scenes, a large library of pre-defined shapes and materials is provided. You can include these shapes and materials in your own scenes by just including the library file name at the top of your scene file, and by using the shape or material name in your scene. Since this is free software feel free to download this version and try it out on your own.
Some of you might have seen version 3.6 of POV-Ray, the biggest difference between 3.6 and 3.7 Beta 25 is SMP (symmetric multiprocessing) support, which means that POVRay can take advantage of as many cores as your CPU has. On Single vs Dual CPU systems the speed almost doubles.
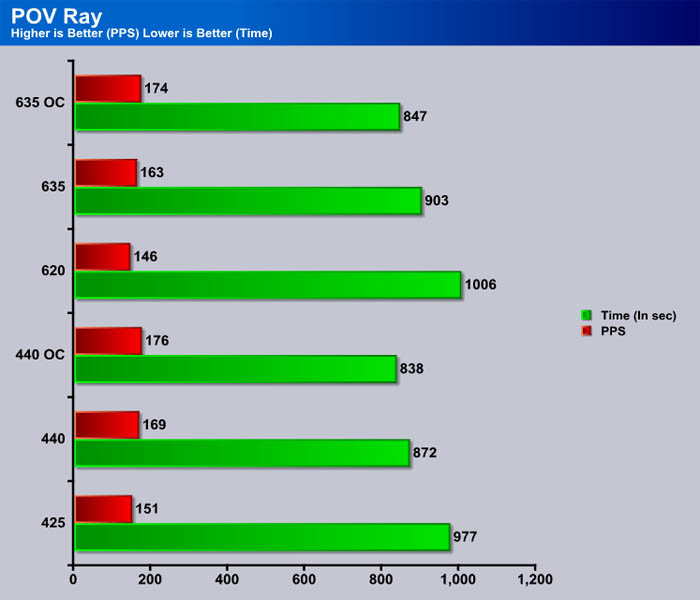
We see here that clock speed is very important for a faster time. During my observations the program used just one core for most of the testing, so the CPU with a higher clock speed would end up being the fastest. Since the overclocked 440 was running at the fastest speed out of all the other CPUs we see it leading the pack with the overclocked 635 right behind.
Microsoft Excel 2007
Monte Carlo Black-Scholes Option Pricing Test
Microsoft Excel is the widely known and most used spreadsheet application for the manipulation and calculation for number crunching. With Excel you can analyze and share information on small scale or the largest scale you can imagine. We’ve seen spreadsheets in every day use that contain literally tens of thousands of numbers and hundreds of equations. Bjorn3D uses two tests in Excel to determine CPU and Motherboard performance.

This workload calculates the European Put and Call option valuation for Black-Scholes option pricing using Monte Carlo simulation. It simulates the calculations performed when a spreadsheet with input parameters is updated and must recalculate the option valuation. In this scenario we execute approximately 300,000 iterations of Monte Carlo simulation. In addition, the workload uses Excel lookup functions to compare the put price from the model with the historical market price for 50,000 rows to understand the convergence. The input file is a 70.1 MB spreadsheet.
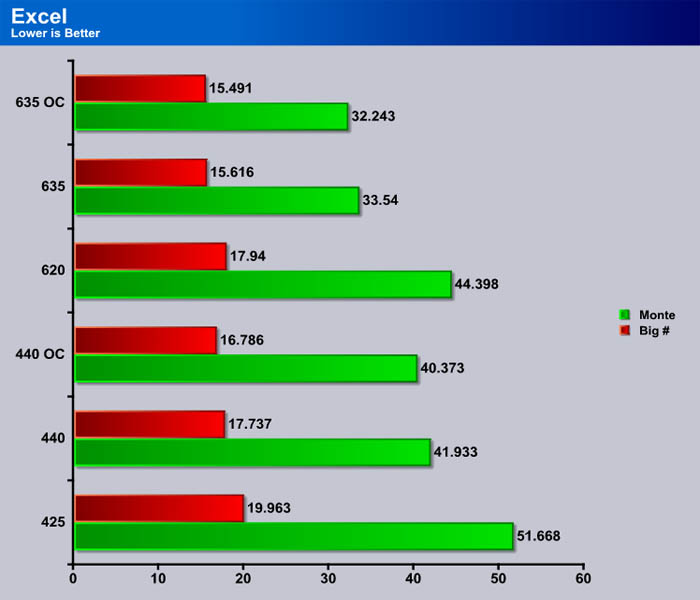
We see here that cores do matter, but they can be made up for with raw speed. The overclocked 440 manages to beat out the 620, but could not muster enough to match the 635 despite having a higher clock speed. We also see that with the smaller test the numbers are closer. If you happen to run programs that take a long time to complete a task (video encoding for example) a faster CPU could literally cut the encoding time in half.
Blender
Blender is a free open source 3D content creation suite that is available for various operating systems. The application is popular among many independent animation studios and game makers. For more information, please visit http://www.blender.org/.
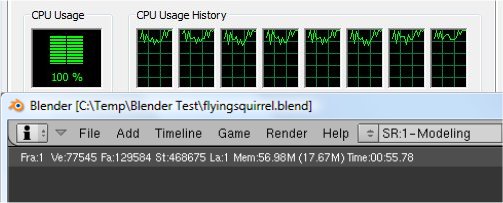
The workload consists of a ~6.9 MB character model of a flying squirrel. Due to time constraints we don’t render the entire image which would be time consuming and rather pointless except to yield larger benchmark numbers. A portion of the image, the right arm is what we render, it’s a large enough portion to show differences in CPU performance, yet small enough that we don’t have to grind through a 45 minute Render waiting for a single result.
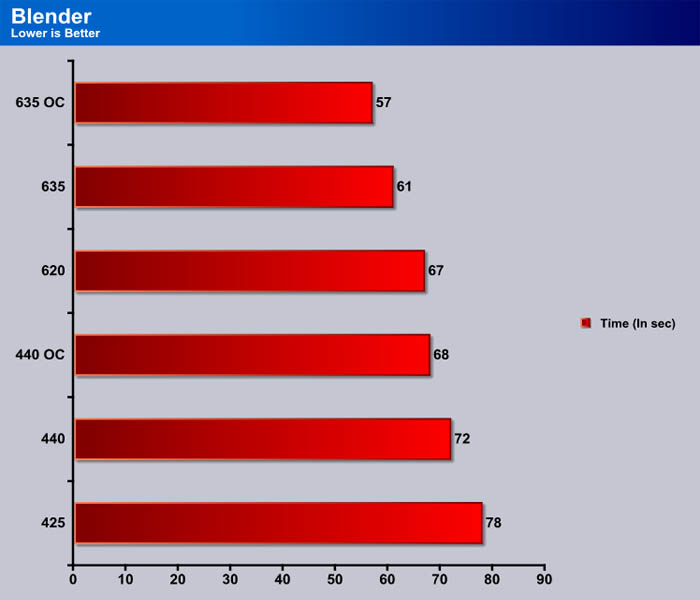
Here is more evidence that the cores matter just as much as the overall speed of the CPU. The overclocked 440 was almost able to beat the 620, but in the end comes in just a second behind. No surprise here that the overclocked 635 puts up the fastest time.
Sisoft Sandra
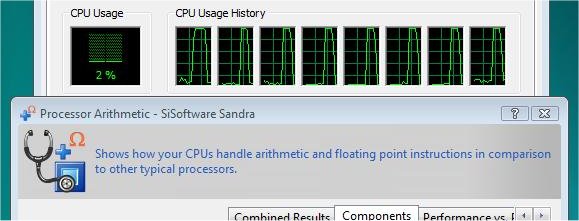
“SiSoftware Sandra (the System Analyser, Diagnostic and Reporting Assistant) is an information & diagnostic utility. It should provide most of the information (including undocumented) you need to know about your hardware, software and other devices whether hardware or software. It works along the lines of other Windows utilities, however it tries to go beyond them and show you more of what’s really going on. Giving the user the ability to draw comparisons at both a high and low-level. You can get information about the CPU, chipset, video adapter, ports, printers, sound card, memory, network, Windows internals, AGP, PCI, PCI-X, PCIe (PCI Express), database, USB, USB2, 1394/Firewire, etc.”
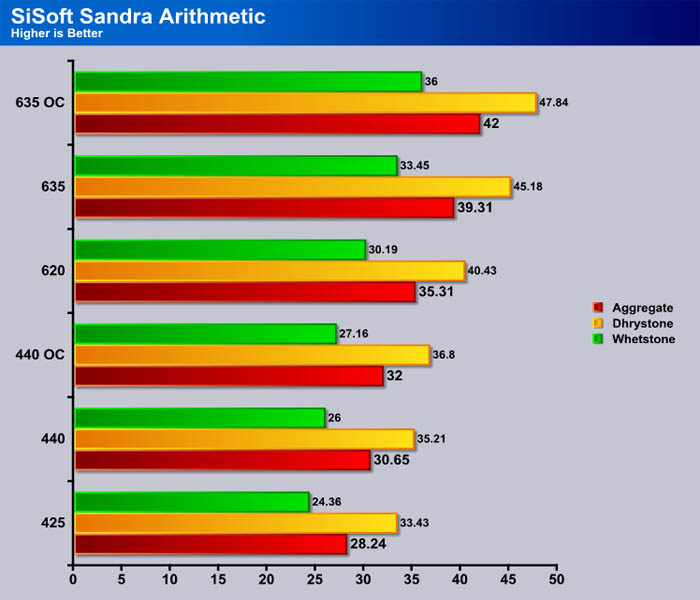
SiSoft is another example of a program that stresses all of the CPU cores. Like in previous tests thats stressed all of the cores efficiently we see that even the 620 manages to beat out the overclocked 440.
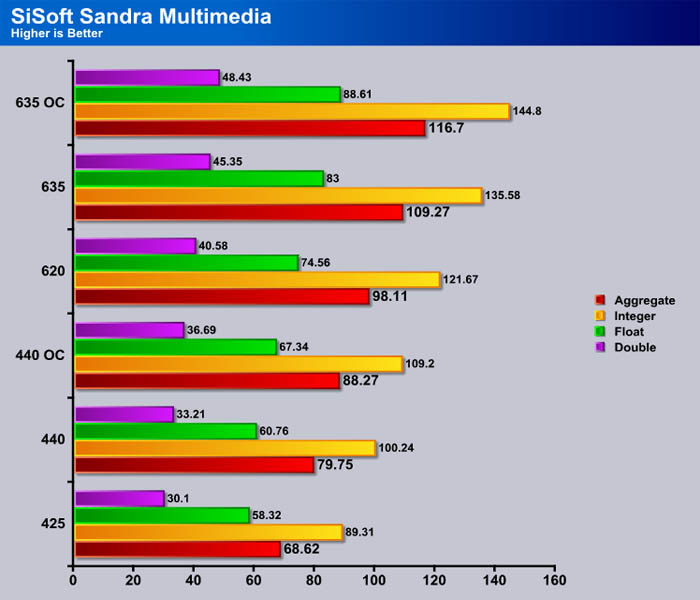
We see a pretty good replication of the previous results in the Multimedia test. The overclocked 635 by far leads the pack throughout all of the testing, which should come as no surprise because it has a core over the 440, and is almost at the same clock speed.
Cinebench

“CINEBENCH is a real-world test suite that assesses your computer’s performance capabilities. MAXON CINEBENCH is based on MAXON’s award-winning animation software, CINEMA 4D, which is used extensively by studios and production houses worldwide for 3D content creation. MAXON software has been used in blockbuster movies such as Spider-Man, Star Wars, The Chronicles of Narnia and many more. MAXON CINEBENCH runs several tests on your computer to measure the performance of the main processor and the graphics card under real world circumstances. The benchmark application makes use of up to 16 CPUs or CPU cores and is available for Windows (32-bit and 64-Bit) and Macintosh (PPC and Intel-based). The resulting values among different operating systems are 100% comparable and therefore very useful with regard to purchasing decision-making. It can also be used as a marketing tool for hardware vendors or simply to compare hardware among colleagues or friends.”
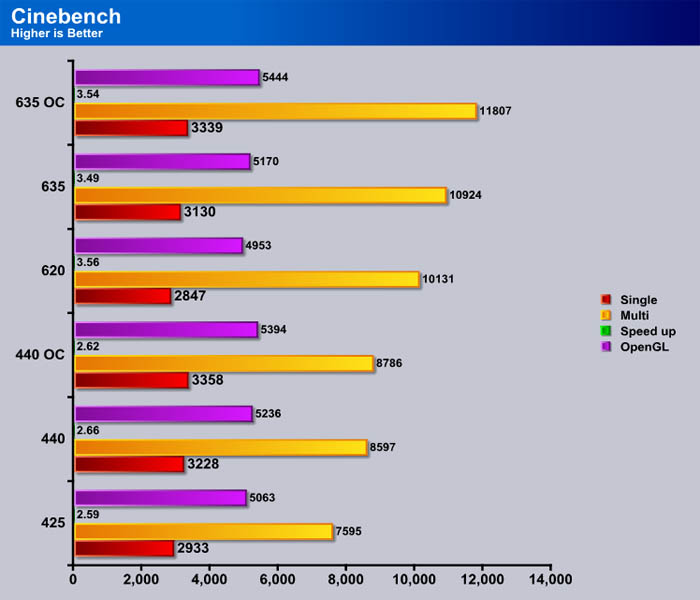
We see here that Cinebench also manages cores excelently. It is always nice to see a slower clocked quad beating a higher clocked CPU with fewer cores, because that means the program is spreading the load throughout the CPU cores.
3DMark Vantage

For complete information on 3DMark Vantage Please follow this Link:
www.futuremark.com/benchmarks/3dmarkvantage/features/
The newest video benchmark from the gang at Futuremark. This utility is still a synthetic benchmark, but one that more closely reflects real world gaming performance. While it is not a perfect replacement for actual game benchmarks, it has its uses. We tested our cards at the ‘Performance’ setting.
Currently, there is a lot of controversy surrounding NVIDIA’s use of a PhysX driver for its 9800 GTX and GTX 200 series cards, thereby putting the ATI brand at a disadvantage. Whereby installing the PyhsX driver, 3DMark Vantage uses the GPU to perform PhysX calculations during a CPU test, and this is where things get a bit gray. If you look at the Driver Approval Policy for 3DMark Vantage it states; “Based on the specification and design of the CPU tests, GPU make, type or driver version may not have a significant effect on the results of either of the CPU tests as indicated in Section 7.3 of the 3DMark Vantage specification and white paper.” Did NVIDIA cheat by having the GPU handle the PhysX calculations or are they perfectly within their right since they own Ageia and all their IP? I think this point will quickly become moot once Futuremark releases an update to the test.
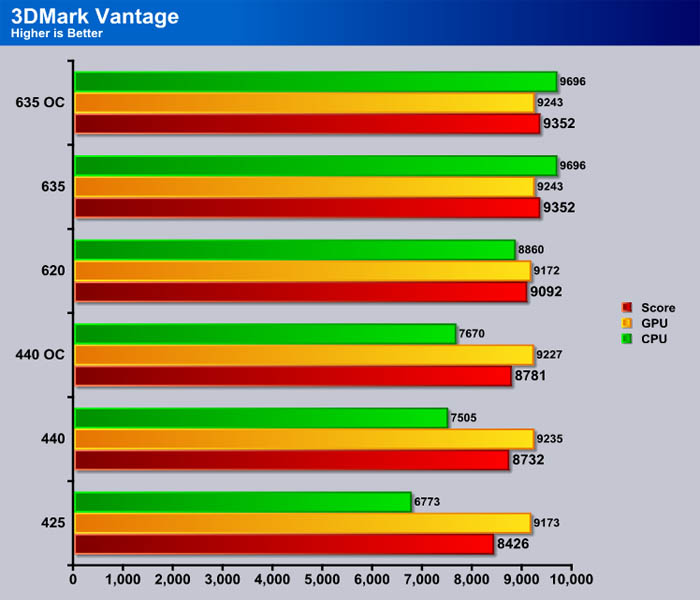
We silently see the overall score rise a bit, but what rises the most is the CPU score. We see here that most likely the 425 is bottlenecking the 5770 at least a little bit. By the time we get up to the overclocked 635 we see that the CPU score has passed has passed the GPU score, thus meaning the CPU shouldn’t be bottlenecking the GPU. If you plan on gaming with this CPU you may want to consider the 635.
Conclusion
The AMD Athlon II X3 440 and 635 are both great additions to the Athlon II lineup. The lineups whole goal is to provide cost effective solutions to the consumer without costing them an arm and a leg. These new additions to the lineup do just this. The 440 is great for someone looking for a higher clocked triple core, and the 635 gives a small speed boost to give you an edge over the 630. This edge is great for anyone looking for high performance without the huge price tag, and features you don’t need (namely the unlocked multiplier). The planned retail price of the 440 is $84 USD, while the 635 will come in at $119 USD.
The speed difference is really the only thing that separates these chips from their counterparts in the Athlon II lineup, so if you are looking to build a gaming computer for the absolute lowest price you are better off buying one of the slower clocked chips for a cheaper price and overclocking them to the same clocks. I feel that these chips are more for family computers, so I don’t think that many people will choose to overclock these CPUs. However if you do plan on overclocking these CPUs I advise you find a motherboard that responds well to a bus overclock, because of the lack of an increasing multiplier.
The lack of L3 cache may seem like a huge negative, but since you can buy the quad core Athlon II for cheaper than a Phenom II, the Athlon II will actually perform higher than the P II chip at the same price point. This is because you would normally have to settle for a tri-core or lower CPU. The extra core on the Athlon II easily makes up for the lack of L3 cache and then some, making this an unbeatable solution for the budget minded consumer.
| OUR VERDICT: AMD Ahtlon II X3 440 & X4 635 | ||||||||||||||||||
|
||||||||||||||||||
|
Summary: The AMD Athlon II X3 440 & X4 635 are an excellent addition to the Athlon II lineup providing power at a low price point so you don’t have to sell your house to afford one. |

| CPU Name | Cores | Clock | L2/L3 Cache | HT Bus | Socket | TDP | Price |
| AMD Phenom II X4 965 BE | 4 | 3.4GHz | 2+6MB | 4000MHz | AM3 | 140W | $179 |
| AMD Phenom II X4 955 BE | 4 | 3.2GHz | 2+6MB | 4000MHz | AM3 | 125W | $165 |
| AMD Phenom II X4 945 | 4 | 3.0GHz | 2+6MB | 4000MHz | AM3 | 125W | $159 |
| AMD Phenom II X4 925 | 4 | 2.8GHz | 2+6MB | 4000MHz | AM3 | 95W | $139 |
| AMD Phenom II X4 910e | 4 | 2.6GHz | 2+6MB | 4000MHz | AM3 | 65W | $169 |
| AMD Phenom II X4 905e | 4 | 2.5GHz | 2+6MB | 4000MHz | AM3 | 65W | $175 |
| AMD Phenom II X4 810 | 4 | 2.6GHz | 2+4MB | 4000MHz | AM3 | 95W | $139 |
| AMD Phenom II X3 720BE | 3 | 2.8GHz | 1.5+6MB | 4000MHz | AM3 | 95W | $104 |
| AMD Phenom II X3 710 | 3 | 2.6GHz | 1.5+6MB | 4000MHz | AM3 | 95W | $99 |
| AMD Phenom II X3 705e | 3 | 2.5GHz | 1.5+6MB | 4000MHz | AM3 | 65W | $119 |
| AMD Phenom II X2 555 | 2 | 3.2GHz | 1+6MB | 4000MHz | AM3 | 80W | $99 |
| AMD Phenom II X2 550 | 2 | 3.1GHz | 1+6MB | 4000MHz | AM3 | 80W | $91 |
| AMD Athlon II X4 635 | 4 | 2.9GHz | 2MB | 4000MHz | AM3 | 95W | $120 |
| AMD Athlon II X4 630 | 4 | 2.8GHz | 2MB | 4000MHz | AM3 | 95W | $102 |
| AMD Athlon II X4 620 | 4 | 2.6GHz | 2MB | 4000MHz | AM3 | 95W | $99 |
| AMD Athlon II X3 440 | 3 | 3.0GHz | 1.5MB | 4000MHz | AM3 | 95W | $84 |
| AMD Athlon II X3 435 | 3 | 2.9GHz | 1.5MB | 4000MHz | AM3 | 95W | $75 |
| AMD Athlon II X3 425 | 3 | 2.7GHz | 1.5MB | 4000MHz | AM3 | 95W | $72 |
| AMD Athlon II X2 255 | 2 | 3.1GHz | 2MB | 4000MHz | AM3 | 65W | $75 |
| AMD Athlon II X2 250 | 2 | 3.0GHz | 2MB | 4000MHz | AM3 | 65W | $65 |
| AMD Athlon II X2 245 | 2 | 2.9GHz | 2MB | 4000MHz | AM3 | 65W | $61 |
| AMD Athlon II X2 240 | 2 | 2.8GHz | 2MB | 4000MHz | AM3 | 65W | $53 |