MSI GTX 660 Ti Power Edition
Testing & Methodology
We’ve expanded our testing suite considerably since the X79 chipset release, and will continue to use the same methods for most of the motherboards and CPU’s we test. In the interests of thoroughness and accurate results, we run each test at least three times, and some tests more than that. We average the total of all the tests from each benchmark then report the average here.
The OS we use is Windows 7 Pro 64bit with all patches and updates applied. We also use the latest drivers available for the motherboard and any devices attached to the computer. We do not disable background tasks or tweak the OS or system in any way. We turn off drive indexing and daily defragging. We also turn off Prefetch and Superfetch. This is not an attempt to produce bigger benchmark numbers. Drive indexing and defragging can interfere with testing and produce confusing numbers. If a test were to be run while a drive was being indexed or defragged, and then the same test was later run when these processes were off, the two results would be contradictory and erroneous. As we cannot control when defragging and indexing occur precisely enough to guarantee that they won’t interfere with testing, we opt to disable the features entirely.
Prefetch tries to predict what users will load the next time they boot the machine by caching the relevant files and storing them for later use. We want to learn how the program runs without any of the files being cached, and we disable it so that each test run we do not have to clear Prefetch to get accurate numbers. Lastly we disable Superfetch. Superfetch loads often-used programs into the memory. It is one of the reasons that Windows occupies so much memory. Vista fills the memory in an attempt to predict what users will load. Having one test run with files cached, and another test run with the files un-cached would result in inaccurate numbers. Again, since we can’t control its timings so precisely, it we turn it off. Because these four features can potentially interfere with benchmarking, and and are out of our control, we disable them. We do not disable anything else.
We are revamping our testing method in order to better represent motherboard performance and offering to the consumer. Also we want to make it an easier read for you without miles of endless charts. We ask that you provide feedback in an effort to help us deliver better reviews for you.
Test Rig
| Test Rig | |
| Case | Open Air Test Bench |
| CPU | Intel Core i7-3770K |
| Motherboard | Gigabyte Z77X-UP5 TH |
| Ram | 16GB Patriot Viper Xtreme 2400MHz + |
| CPU Cooler | Swiftech H20-320 Edge |
| Hard Drive | Western Digital Velociraptor 300GB |
| SSD | Intel 510 series SATA III 120GB |
| Optical | ASUS BD-ROM |
| GPU | MSI GTX 660 Ti Power Edition |
| Additional Cards |
N/A |
| PSU | Thermaltake Toughpower Grand 1200W |
| Mouse | Tt eSPORTS Black gaming mouse |
| Keyboard | Tt eSPORTS Meka G1 mechanical gaming keyboard |
Test Suite
We will use the following applications to test the performance of the graphics card.
Synthetic Benchmarks & Games
| Benchmarks |
|---|
| 3DMark11 |
| Just Cause 2 |
| Sniper elite V2 |
| Metro 2033 |
| Unigine Heaven |
Overclocking

The GTX 660 Ti Power Edition is just like all of the other 6 series models in which it clocks via the boost clock to give you the overclock you want. Some overclockers and benchmarkers find this to be a pain as on top of the boost clock there is a dynamic clock which kicks in and can overclock even higher depednig upon power target and thermal envelope. This is nice for gamers as it gives a free performance boost in some applications, but for those running on the ragged edge (such as extreme benchmarkers) this can be a huge hindrance as it’s just another variable they have to contend with to get top clocks.
The MSI 660 Ti Power Edition comes out of the box clocked below the competition, with a base GPU clock of 1020 and boost of 1098. This capped off our max observed dynamic clock at 1175, which was actually quite good due to likely power target tuning to give the card more headroom.
| Clock | Max stable MHz |
| GPU Base clock | 1122 |
| GPU Boost Clock | 1137 |
| Max dynamic clock Observed | 1241 |
| Memory clock | 1755 (7020) |
When overclocked, the card wakes up quite well with a good showing and a dynamic boost clock beating the GIGABYTE card but falling slightly short of the Zotac and ASUS models. This allows for some very good performance, but as always, GPU and CPU overclockability varies slightly by chip sample; this one seems to hold some promise.
Memory overclocking for the MSI offering was the best by 20MHz, as it topped out at 1755MHz (7020MHz QDR). This is a strong showing and likely made up the difference for any GPU clock it might be lacking.
In order to ensure no system bottleneck we clocked the CPU to 4.6GHz to ensure there is no reason the system will slow down the cards performance at all.
Some may ask why we chose the mainstream Z77 system, and we can explain. Up until recent the X79 enthusiasts platform did not really support PCI-E Gen 3 on the Nvidia 600 series GPU’s. Because of the inherent instability many have seen with the X79 platform with Gen 3 products, Nvidia has been hesitant to enable it, and now there is a workaround via registry to get it working. However, in order to ensure the most consistent testing possible, we have stuck to the natively supported Z77 platform.
Important note: Overclocking can cause component failure. Please exercise caution when attempting any level of overclock on system components.
Temperatures

The temperatures were recorded with full loaded Heaven benchmark looping for over 30 minutes or longer depending how long it took for the card to level out in temps and sat at a plateau for more than 10 minutes.
| GPU Temperatures | Temperature (Idle/Load) |
| MSI GTX 660 Ti Power Edition OC | 33C/70C |
| MSI GTX 660 Ti Power Edition | 32C/68C |
The Twin Frozr cooler kept the card in a very workable temperature range, and we actually ran out of air cooling GPU overclockability before we ran out of temperature headroom.
Real world/Gaming Benchmarks
3DMARK 11
![]()
3DMark 11 is the newest in Futuremark’s suite of benchmarking utilities. Its a fully capable DirectX11 benchmark which also stresses and analyzes the system performance as a whole to simulate a heavy rendering environment such as a high end game or other app the end user may run. This benchmark was run with Performance settings 5 times and all runs were averaged for the result below.
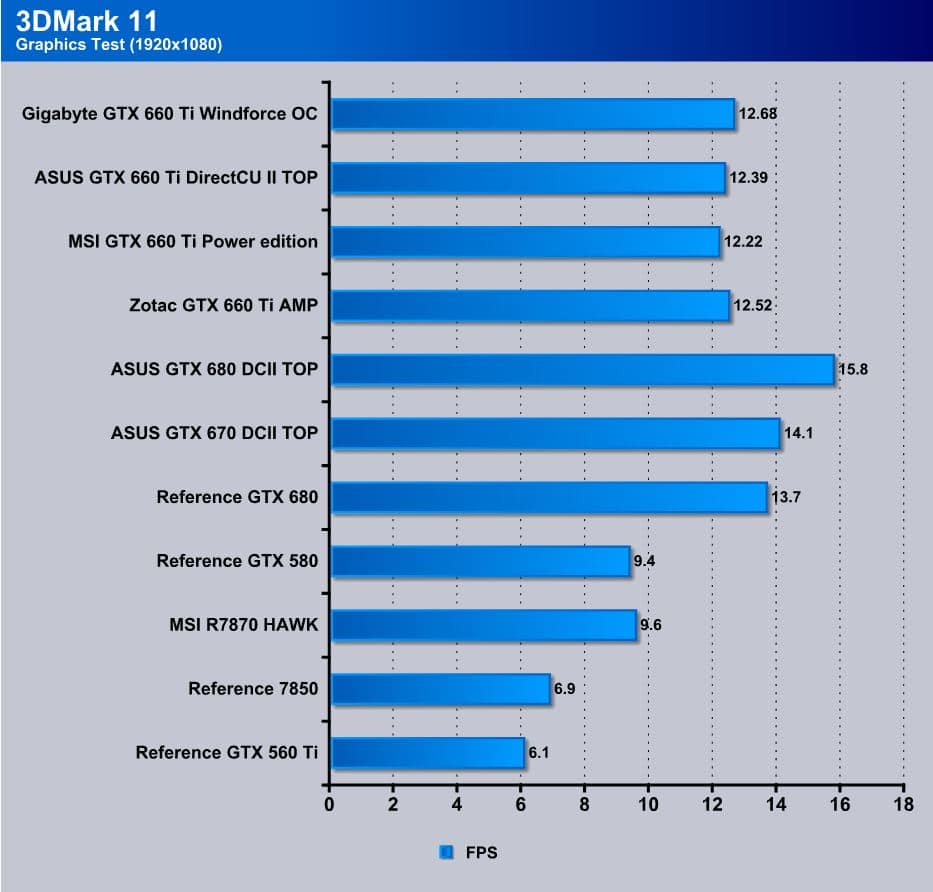
3DMark 11 shows a nice picture of the cards placement as it falls right behind the 670/680’s and well ahead of the 580. Now we just need some 7950’s to add to this mix. The MSI card falls a little behind here as the lower base and related boost and dynamic clock simply put it a step behind. MSI may be coming out with a HAWK version of the 660 Ti, which may perform better than this card.
Heaven Benchmark 3.0

Heaven Benchmark version 3.0 is the newest iteration from Unigine and a improvement to stability along with I am noticing much more consistent scoring as well.
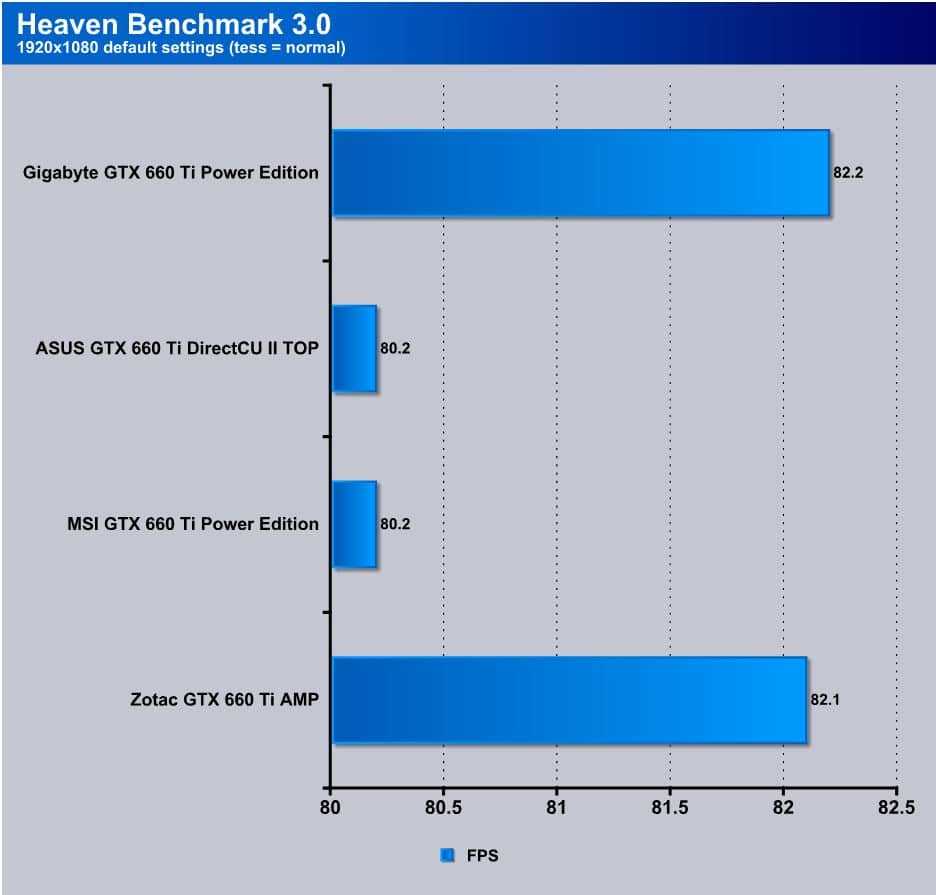
In order to make sure we got these cards tested and up to show off to you guys we did not have time to retest our card suite in this newest benchmark, although we hope to update that very soon. Till then, you can compare the different 660 Ti’s we have here.
Metro 2033
![]()
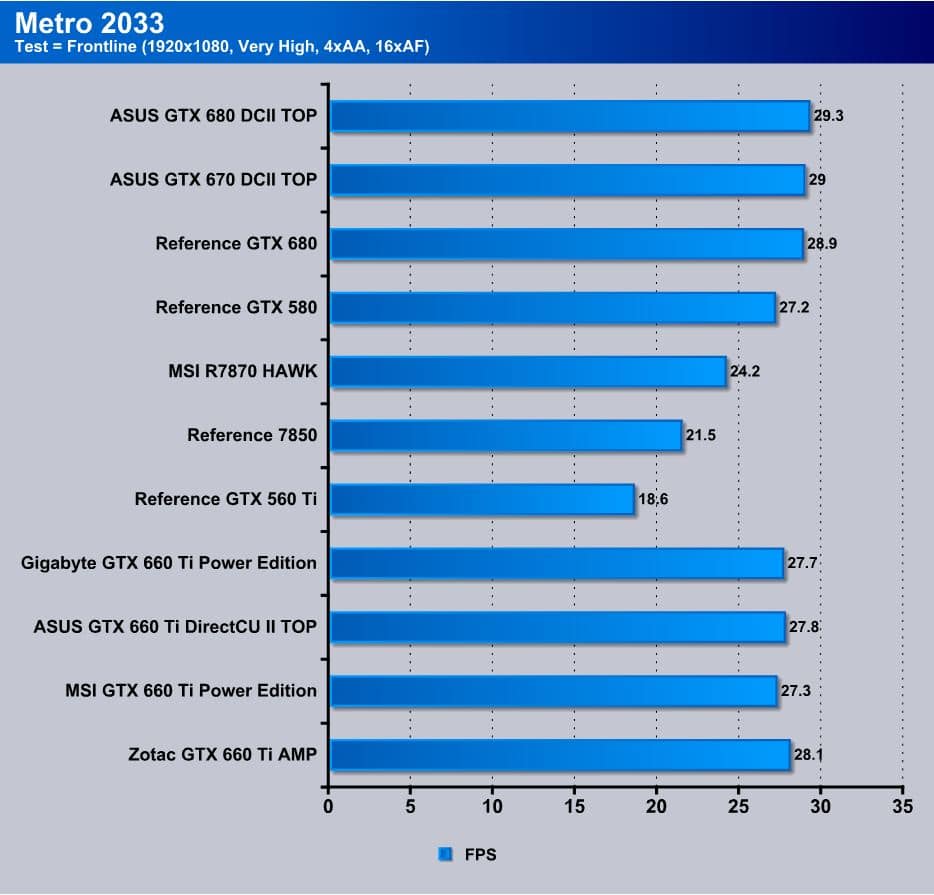
Metro 2033 has always been extraordinarily stressful for GPU’s, and this has not changed with time. The 660 Ti cannot play Metro 2033 without minimum framerate, but for a midrange performance card it definitely holds its own as the previous generation flagship GTX580 is bested by this midrange beast. The MSI card is simply outmatched at stock due to the lower clockspeeds, but it still performs great and within a percent of its upper clocked buddies. Also one thing to consider here is that these cards can overclock well, so when clocking it will even the playing field considerably.
Just Cause 2

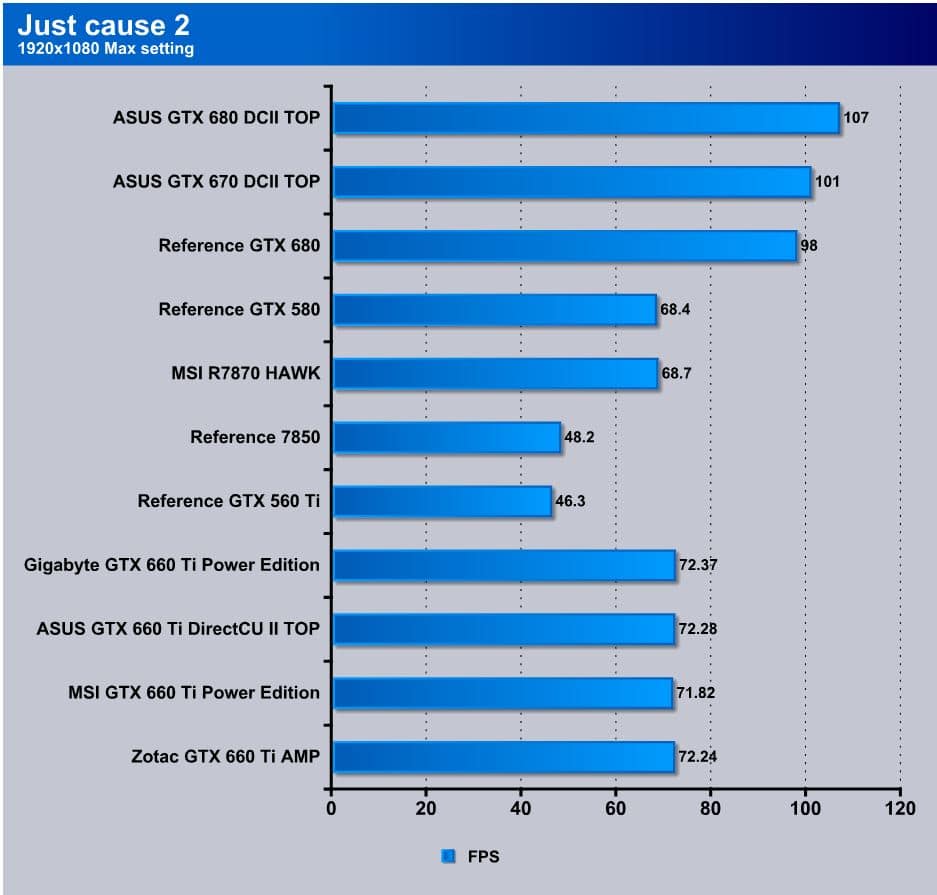
We brought a rather old but good game back for testing this card. The MSI card is off pace by about 0.5 FPS which is not even visible in real world experience.
Sniper Elite V2
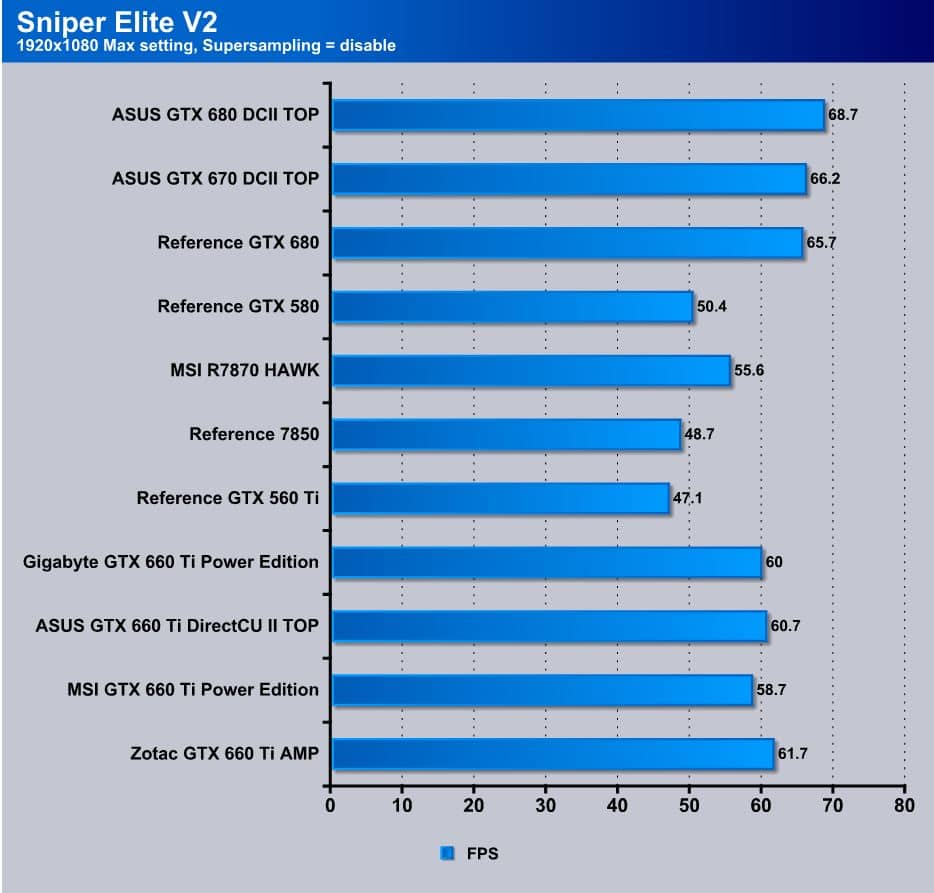
Those of you that have been paying attention to games recently will know that Sniper Elite V2 was recently released on the scene only a few months back. It is a fun game and once we found a benchmark tool we knew we had to put it in a review. The game is as it sounds: you are a sniper and your job is to sneak around and kill pretty much anything that moves. It has an x-ray mode that shows bones breaking or being shattered with hits.
Here the 660 Ti’s definitely shine as they clearly leap over the previous gen 580 again and from the looks of the FPS numbers this could be in or even beating the 7950 territory.


If you can stand the noise, then MSI 660 TI is for you. Good rig in fact.
i don’t understand this comment…this card is quiet and powerful