
With the Intel Core i7-3970X taking the crown for the fastest six-core processor for the desktop market, how can this 150W TDP monster compare to its younger brother, the i7-3960X? Can the $10 difference in price justify its performance and stability? In this review the Core i7-3960X and the Core i7-3970X go head-to-head in some real-world application benchmarks.
Introduction
While ultrabooks, tablets, All-in-One systems and new small hand-held devices are becoming the main focus for microprocessor manufacturers like Intel, we have not seen too much activity in the enthusiast high-end market for desktop users. Last we’ve heard, Intel released their X79 chipset platform along with their top of the line i7-3960X Extreme processor back in November, 2011, but nothing has really replaced the chipset and we’ve haven’t seen any new enthusiast platforms either. As a matter a fact, the X79 chipset is likely to stay with us for a tad bit longer, considering the upcoming Ivy Bridge-E processors are rumored to work great on the same LGA2011 X79 chipset.
On the other hand, we have heard a bit about Haswell at the Consumer Electronics Show 2013 (CES 2013), and we saw a live preview of a system running Dirt 3 at 1920 x 1080 resolution and with high preset settings, but without AA. On the GT-3 integrated graphics processor unit, Dirt 3 played without any hitches or lags, but Haswell cannot be looked at as the next-generation enthusiast-level architecture. It will on the other hand be a great leap in technology with an improved 22nm manufacturing process containing the same Tri-Gate transistor design that was first launched with the Ivy Bridge architecture earlier last year. This usually means higher performance on the same manufacturing process due to architecture changes, newer instruction sets and improvements in efficiency. We’ve also heard reports of the next-generation Haswell HD4600 series iGPU (GT-3) to be about twice as fast as current generation Ivy Bridge based HD 4000 series graphics.
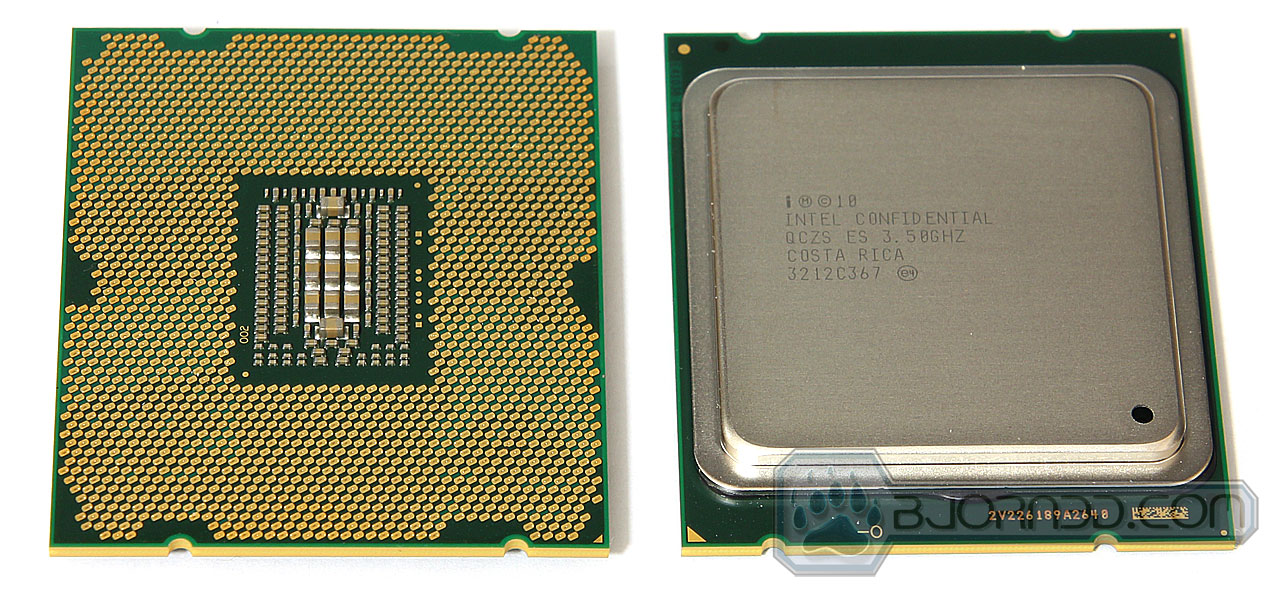
But with Haswell aside, what we have here today is Intel’s latest i7-3970X Extreme Edition CPU. The i7-3970X does not necessarily replace the i7-3960X, but instead takes a small leap in performance to cater for those looking for a bit more performance over the i7-3960X. The i7-3970X comes in at a small 200 MHz performance increase on stock settings, while giving the user a even smaller 100 MHz boost at Turbo speeds. The processor also has a higher TDP of 150W over the 130W standard, meaning that we’re not looking at a completely redesigned chip, but instead a “factory overclocked” processor that is sold with a small boost in performance. Before throwing the chip into our system, we can somewhat predict a higher operating temperature over the 3960X, as we will have to deal with a higher thermal output due to the higher clock speeds. However, we do expect a slightly better overclocking potential on the 3970X, due to its later release and newer revised core.
| Specifications | Intel Core i7-3960X | Intel Core i7-3970X |
| Core Clock | 3.3 GHz | 3.5 GHz |
| Cores / Threads | 6 / 12 | 6 / 12 |
| L3 Cache | 15 MB | 15 MB |
| Max Turbo | 3.9 GHz | 4 GHz |
| Max Overclock Multiplier | 57x | 57x |
| TDP | 130 W | 150 W |
| Lithography | 32 nm | 32 nm |
| Voltage Range | 0.6V – 1.35V | 0.6V – 1.35V |
| Price (Box) | $1069.99 | $1079.99 |
To find out more about the X79 chipset and the Core i7-3960X released in November 2011, you can read more about it in our launch review.
Testing Methodology

The OS we use is Windows 8 Pro 64bit with all patches and updates applied. We also use the latest drivers available for the motherboard and any devices attached to the computer. We do not disable background tasks or tweak the OS or system in any way. We turn off drive indexing and daily defragging. We also turn off Prefetch and Superfetch. This is not an attempt to produce bigger benchmark numbers. Drive indexing and defragging can interfere with testing and produce confusing numbers. If a test were to be run while a drive was being indexed or defragged, and then the same test was later run when these processes were off, the two results would be contradictory and erroneous. As we cannot control when defragging and indexing occur precisely enough to guarantee that they won’t interfere with testing, we opt to disable the features entirely.
Prefetch tries to predict what users will load the next time they boot the machine by caching the relevant files and storing them for later use. We want to learn how the program runs without any of the files being cached, and we disable it so that each test run we do not have to clear pre-fetch to get accurate numbers. Lastly we disable Superfetch. Superfetch loads often-used programs into the memory. It is one of the reasons that Windows Vista occupies so much memory. Vista fills the memory in an attempt to predict what users will load. Having one test run with files cached, and another test run with the files un-cached would result in inaccurate numbers. Again, since we can’t control its timings so precisely, it we turn it off. Because these four features can potentially interfere with benchmarking, and and are out of our control, we disable them. We do not disable anything else.
We ran each test a total of 3 times, and reported the average score from all three scores. Benchmark screenshots are of the median result. Anomalous results were discounted and the benchmarks were rerun.
Test Rig
| Test Rig | |
| Case | Aerocool Striker-X Air (Test Bench) |
| CPUs |
|
| Motherboards | ASUS Rampage IV Extreme |
| Ram | Kingston HyperX Genesis 16GB (4x4GB) 2133Mhz 11-12-11-30 Quad-Channel Kit |
| CPU Cooler | Thermaltake Frio OCK |
| Hard Drives | 1x Seagate Barracuda 1TB HDD |
| SSD | 1x Kingston HyperX 240GB SATA III 6Gb/s SSD |
| Optical | ASUS DVD-Burner |
| GPU | NVIDIA GeForce GTX 690 2x2GB (4GB) Video Card |
| PSU | Rosewill Lightning-1300 1300W Modular PSU |
| Mouse | Razer Imperator Battlefield 3 Edition |
| Keyboard | Razer Blackwidow Ultimate Battlefield 3 Edition |
Synthetic Benchmarks & Games
| Benchmarks |
|---|
| AIDA64 |
| SuperPi Mod 1.5 |
| wPrime 1.55 |
| Cinebench R11.5 |
| X264HD |
| Truecrypt 7.1 |
| 3DMark 11 |
| Metro 2033 |
| Just Cause 2 |
| Other Stability Tests |
|---|
| Overclocking |
| Temperatures |
| Power Consumption |
Application Benchmarks
AIDA64 Extreme Edition
AIDA64 Extreme Edition helps us measure the performance of the internal memory controller (IMC), and the performance of the built in L1, L2 and L3 cache within the processor.

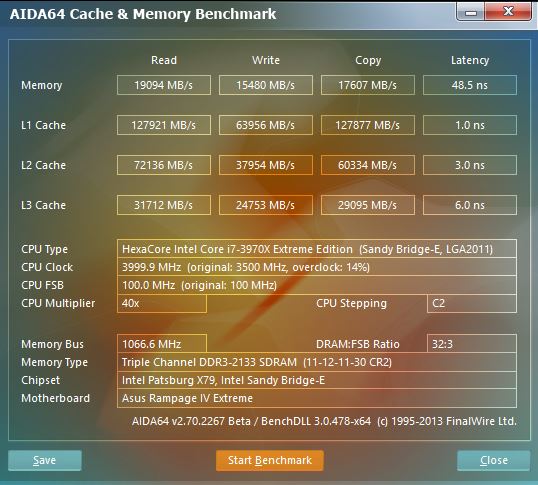
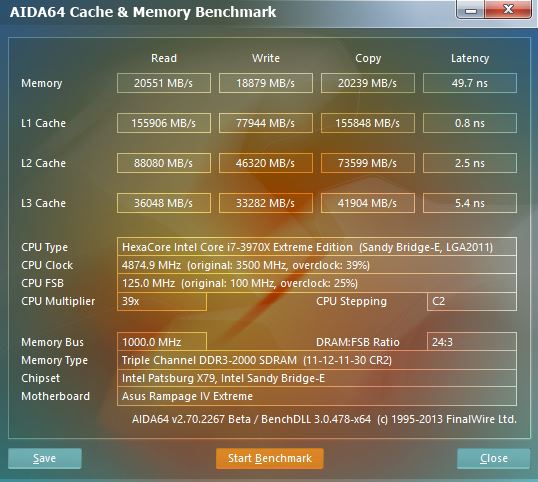
(i7-3960X – left, i7-3970X – center, i7-3970x @ 4.875GHz – right)
The results for the i7-3970X do not raise any eyebrows, as the performance increase is very small between the the stock i7-3960X and the i7-3970X. However, with an overclocked CPU, we start to see the benefits higher frequency memory modules. While the performance of the L1, L2, L3 cache has jumped quite a bit on the read, write and copy, we can see the same increase in performance on the memory as well. Do keep in mind that due to the increased CPU FSB, we had to lower the speed of our memory from 2133 MHz to 2000 MHz, while maintaining the same memory timings. Even with a slower memory frequency and same timings, the overall performance has jumped. By adjusting the timings according to the lower frequencies, we could technically achieve even higher performance.
SuperPi Mod 1.5
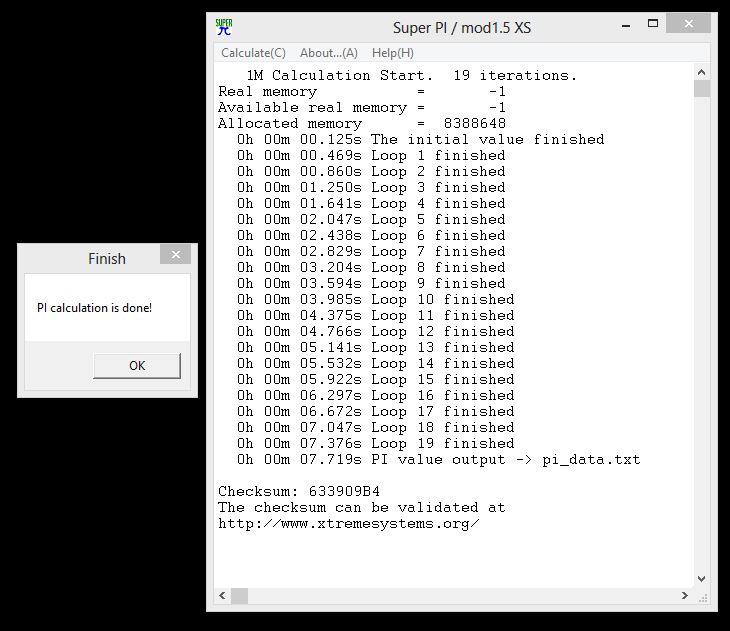
SuperPi Mod 1.5 allows us to measure the time it takes to calculate Pi to a certain number of digits. This particular benchmark is strictly single threaded, therefore only a single core is used to measure the performance of the processor. In this benchmark we will be running a 1 million and 8 million digit tests.

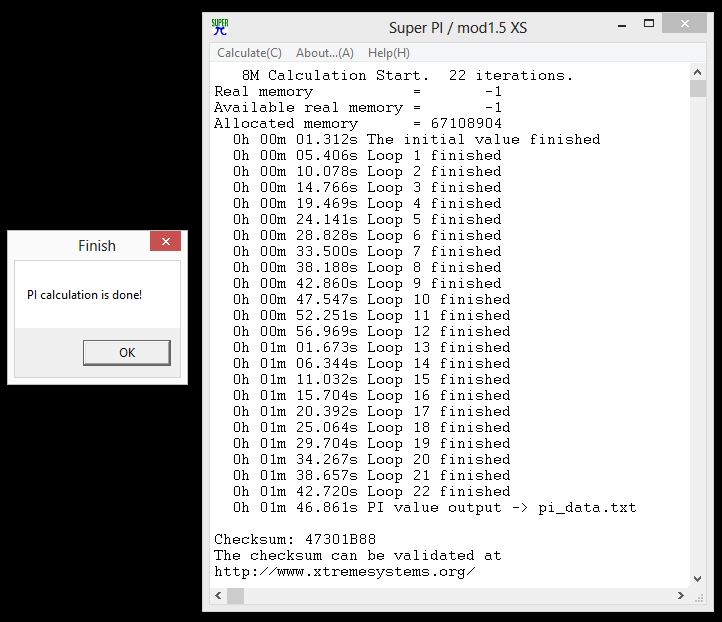
(Intel Core i7-3960X)

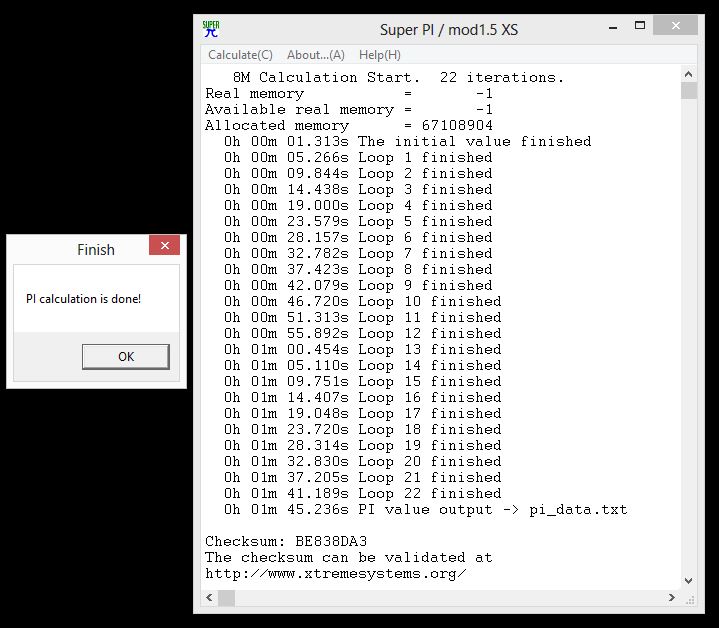
(Intel Core i7-3970X)

(Intel Core i7-3970X @ 4.875GHz)
| SuperPi Mod 1.5 | 1M Calculation | 8M Calculation |
| Intel Core i7-3960X | 9.688 sec | 1min 46.861 sec |
| Intel Core i7-3970X | 9.532 sec | 1min 45.236 sec |
| Intel Core i7-3970X @ 4.875GHz | 7.719 sec | 1min 27.190 sec |
The results are just as we’ve expected. We see a slight 1.61% performance increase on from the i7-3960X to the i7-3970X, and a whooping 23.49% performance increase at 4.875 GHz from a stock i7-3960X in the 1M calculation. We see very similar results for the 8M calculation between the two processors, but only a 17.15% increase in overclocked performance.
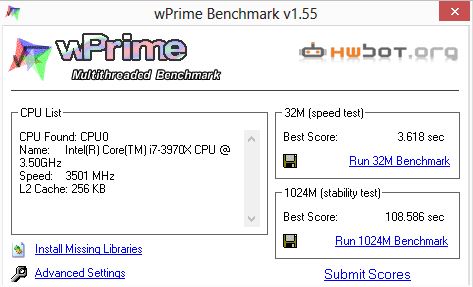
wPrime 1.55
wPrime is a leading multithreaded benchmark (meaning it uses more than a single core) for x86 processors that tests your processor performance by calculating square roots with a recursive call of Newton’s method for estimating functions, with f(x)=x2-k, where k is the number we’re sqrting, until Sgn(f(x)/f'(x)) does not equal that of the previous iteration, starting with an estimation of k/2. It then uses an iterative calling of the estimation method a set amount of times to increase the accuracy of the results. It then confirms that n(k)2=k to ensure the calculation was correct. It repeats this for all numbers from 1 to the requested maximum.
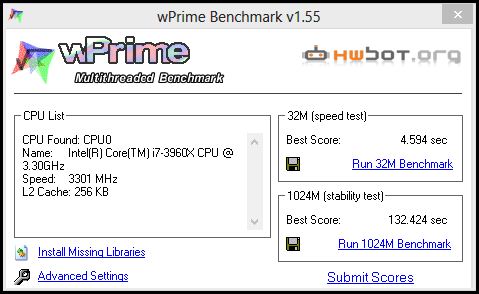
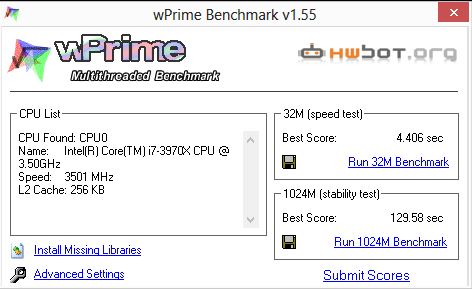
(i7-3960X – left, i7-3970X – center, i7-3970x @ 4.875GHz – right)
| wPrime v1.55 | 32M Calculation | 1024M Calculation |
| Intel Core i7-3960X | 4.594 sec | 132.424 sec |
| Intel Core i7-3970X | 4.406 sec | 129.58 sec |
| Intel Core i7-3970X @ 4.875GHz | 3.618 sec | 108.586 sec |
Here we can see a true representation of the mathematical calculations done by the processor and how the different specifications between the processors translate in real-world computational performance. We’ll look at the longer 1024 Million calculation to get a better representation of long caculation performance. The Intel Core i7-3960X managed to finish the calculation in 132.424 seconds, while the new Intel Core i7-3970X did the same calculation in about 3 sec faster at 129.58 seconds. This is roughly 2.2% performance increase from the i7-3960X. When we push the i7-3970X to 4.875 GHz with the same cooling with the Thermaltake Frio OCK air cooler, we get about 21 seconds faster performance. That’s almost a 20% increase in performance in a multithreaded calculation. Not bad.
Cinebench R11.5


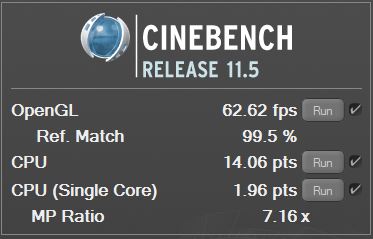
| Cinebench Release 11.5 | OpenGL | CPU (Multi) | CPU (Single) |
| Intel Core i7-3960X | 52.35 fps | 11.35 pts | 1.57 pts |
| Intel Core i7-3970X | 53.58 fps | 11.62 pts | 1.61 pts |
| Intel Core i7-3970X @ 4.875GHz | 62.62 fps |
14.06 pts |
1.96 pts |
With Cinebench R11.5 being our first real-world application benchmark that most of the enthusiast users will most likely think about using the processor for, we see the usual but similar 2.38% increase in performance on the i7-3970X over it’s predecessor, the i7-3960X. Similar performance increases are found for both the GPU test, which means that Cinebench still relies on the efficiency of the processor even when it comes to GPU performance.
X264HD

X264 is one of the most used codecs for the MPEG4 file format used in videos, especially for HD video streaming and much more. With its small file format and great video quality, it became one of the main formats to use when sharing videos with your friends and family, and of course for uploading your videos online to Youtube or other video sharing websites. This particular benchmark allows you to measure how fast your PC can encode a 1080p video clip into a high quality x264 video file.
| X264HD Video Converting | Pass 1 | Pass 2 |
| Intel Core i7-3960X | 86.18 fps | 21.15 fps |
| Intel Core i7-3970X | 87.46 fps | 21.60 fps |
| Intel Core i7-3970X @ 4.875GHz | 104.96 fps | 25.35 fps |
No surprise here. The performance efficiency is exactly the same between the processors here than in our previous benchmarks. One thing to note however is the fact that video encoding can take many hours depending on the type of video, the length of the video and many other aspects. If we were to convert a short 5 second video to a different format, the 1-2 FPS difference would not mean much in overall rendering time. But if we were to convert a 1 hour long video to another format, all of a sudden the small difference in performance could save you minutes or hours of your time. Take for example the overclocked i7-3970X, which is 17.5 FPS difference from the stock i7-3970X. This is a 20% performance increase over the stock CPU. If a movie would normally take 1 hour to convert on a stock CPU, a 20% performance increase would save you 12 min of rendering time. Doesn’t sound like much, but after encoding many videos, this can be a huge time saver.
Truecrypt 7.1

TrueCrypt is software for establishing and maintaining an on-the-fly-encrypted volume (data storage device). On-the-fly encryption means that data is automatically encrypted right before it is saved and decrypted right after it is loaded, without any user intervention. No data stored on an encrypted volume can be read (decrypted) without using the correct password/keyfile(s) or correct encryption keys. Truecrypt comes with a built in benchmark tool, which can give us a good idea of the processor encryption and decryption performance.
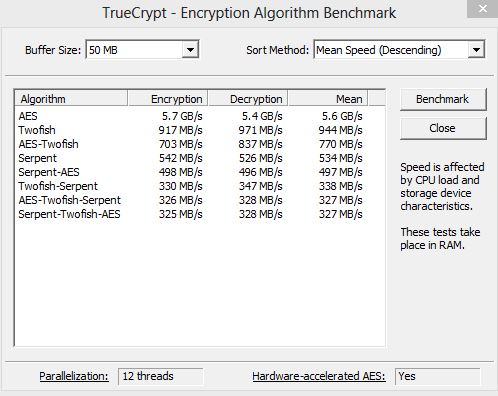
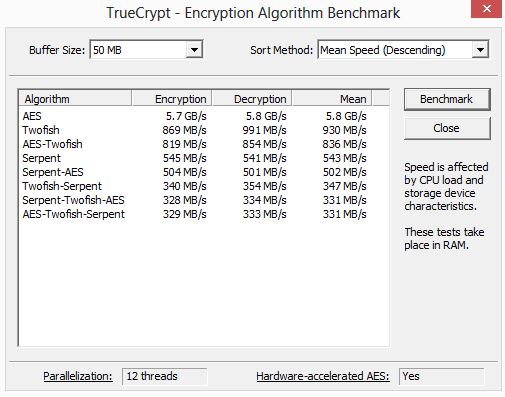
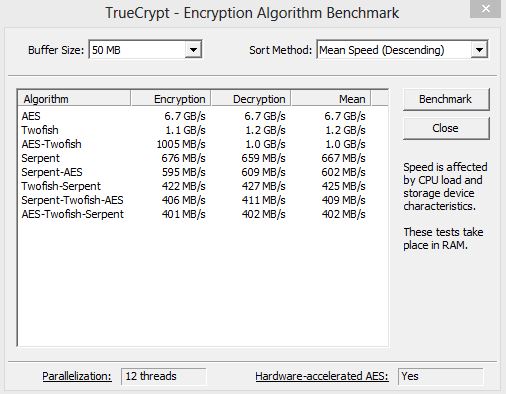
(i7-3960X – left, i7-3970X – center, i7-3970x @ 4.875GHz – right)
Synthetic Benchmarks
3DMark 11
![]()
3DMark 11 is a set of 6 benchmark test for measuring the graphics performance of gaming PCs. 3DMark 11 makes extensive use of all the new features in DirectX 11 including tessellation, compute shaders and multi-threading. Trusted by gamers worldwide to give accurate and unbiased results, 3DMark 11 is the best way to consistently and reliably test DirectX 11 under game-like loads. Today we’re checking out if CPU performance can have a big effect on gaming performance.


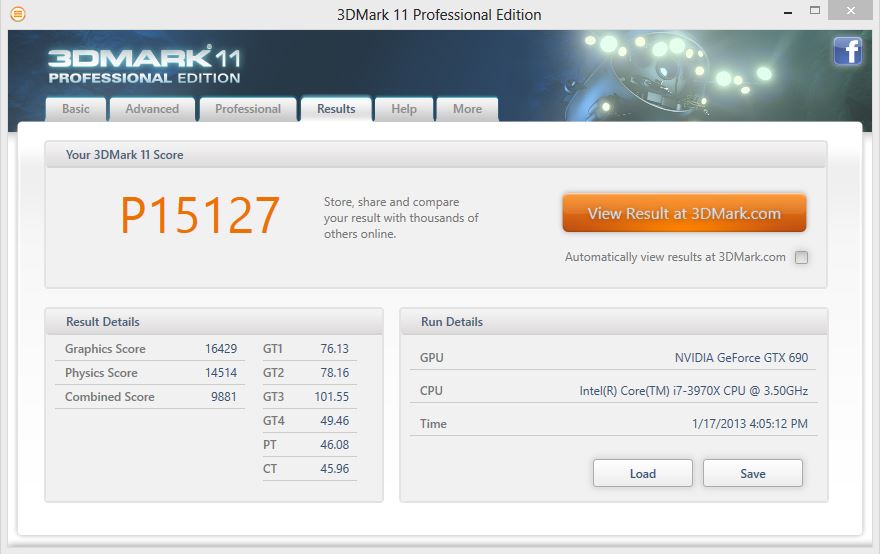
(i7-3960X – left, i7-3970X – center, i7-3970x @ 4.875GHz – right)
| 3DMark 11 Professional Edition | 3DMark Score | Graphics Score | Physics Score | Combined Score |
| Intel Core i7-3960X | P14656 | 16421 | 12312 | 9642 |
| Intel Core i7-3970X | P14770 | 16495 | 12482 | 9788 |
| Intel Core i7-3970X @ 4.875GHz | P15127 | 16429 | 14514 | 9881 |
From overall 3DMark Score results, we can see that there is only a very slight difference in graphics performance between the two processors. Even an overclocked processor only gives us a slight performance increase in overall gaming performance, however we can see a bigger performance increase in the Physics Score. Let’s take a look at some other games.
Game Benchmarks
Metro 2033
![]()
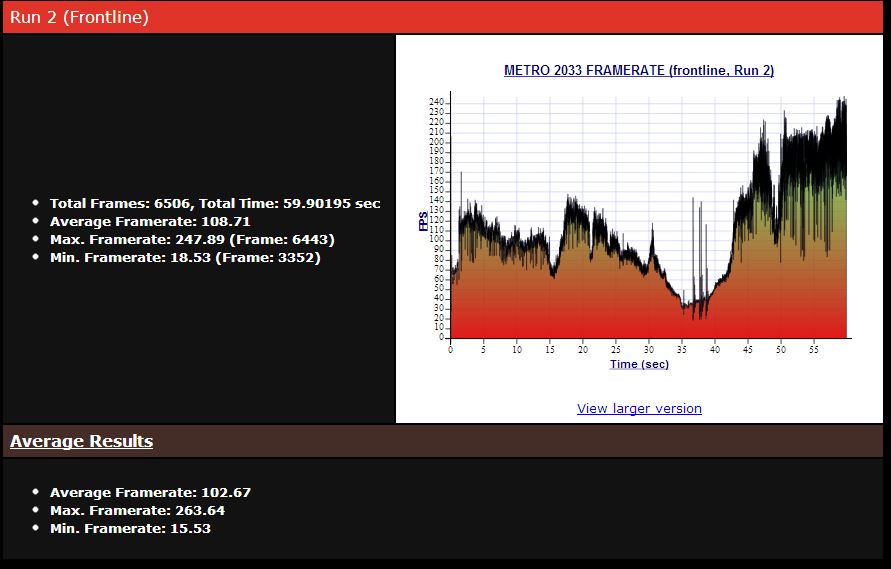

(Intel Core i7-3960X)
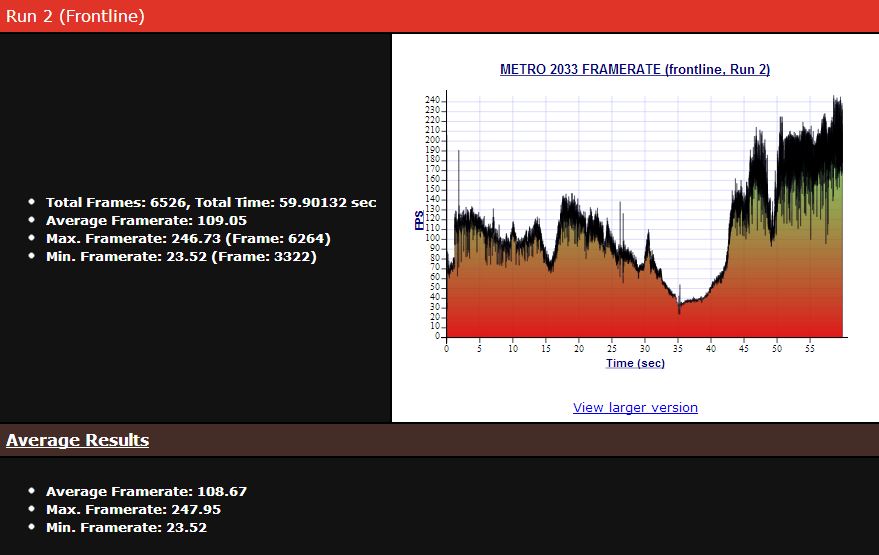

(Intel Core i7-3970X)

(Intel Core i7-3970X – 4.875GHz)
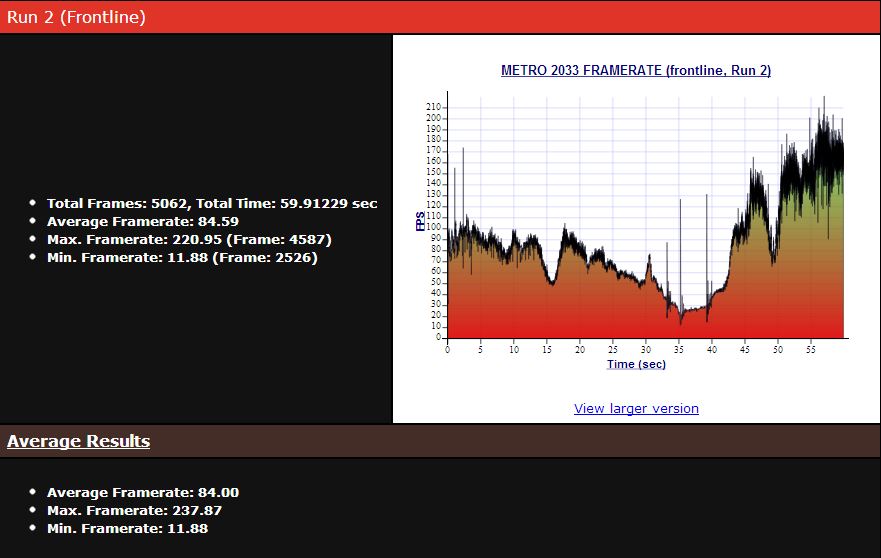
| Metro 2033 (DX11, Very High, 4X AA, 16X AF, no DOF) | 1280 x 1024 | 1920 x 1080 |
| Intel Core i7-3960X | 102.67 FPS | 80.67 FPS |
| Intel Core i7-3970X | 108.67 FPS | 82.33 FPS |
| Intel Core i7-3970X @ 4.875GHz | 110.33 FPS | 84.00 FPS |
Metro 2033 is one of the most GPU intensive games we’ve been testing for the past few years. It’s a good GPU benchmark, but we’re also interested in how the CPU can effect these GPU intensive games. We notice a nice 6 FPS gap between the i7-3960X and the i7-3970X at a lower resolution of 1280 x 1024. On the other hand at 1920 x 1080, this performance gap becomes only about 1.6 FPS. When we overclocked the i7-3970X to 4.875GHz, we did not notice as much of a jump in performance as we have seen between the 3.3GHz i7-3960X and the 3.5GHz i7-3970X, considering that we’ve overclocked the processor quite a bit. The difference at 1920 x 1080 is roughly about 1.6 FPS once again.
Just Cause 2

| Just Cause 2 (Max Settings, 8X AA, 16X AF) | 1280 x 1024 | 1920 x 1080 |
| Intel Core i7-3960X | 177.56 FPS | 154.64 FPS |
| Intel Core i7-3970X | 181.34 FPS | 152.09 FPS |
| Intel Core i7-3970X @ 4.875GHz | 195.43 FPS | 158.45 FPS |
Just Cause 2 on the other hand showed us some very interesting results. While we tested the game several times for discrepancies, we still got a lower FPS result for our 1920 x 1080 benchmark run for the i7-3970X than what the i7-3960X got us. At a lower resolution of 1280 x 1024, this was not an issue and we can see a clear difference in performance between the locked speeds of the processors.
Other Stability Tests
TEMPERATURES

For our temperature testing, we have used LinX 0.6.4, which is a linkpack based benchmarking tool for stability testing. We ran the tool for 10 min before taking the final load measurements. LinX 0.6.4 is a very stressful benchmark for your system, as it puts more load on the processor than any other application that would run on your system 24/7. Because of this we can expect higher temperatures than normal. While some of our reviewers might run other applications for stability testing, I usually run LinX, because if I can find a stable location for my overclocked CPU with LinX, then I know my system will be rock solid no matter what I throw at it. Of course for good measure it is a good idea to run other stress applications as well to load it with a different type of calculations when settling for a final overclock.
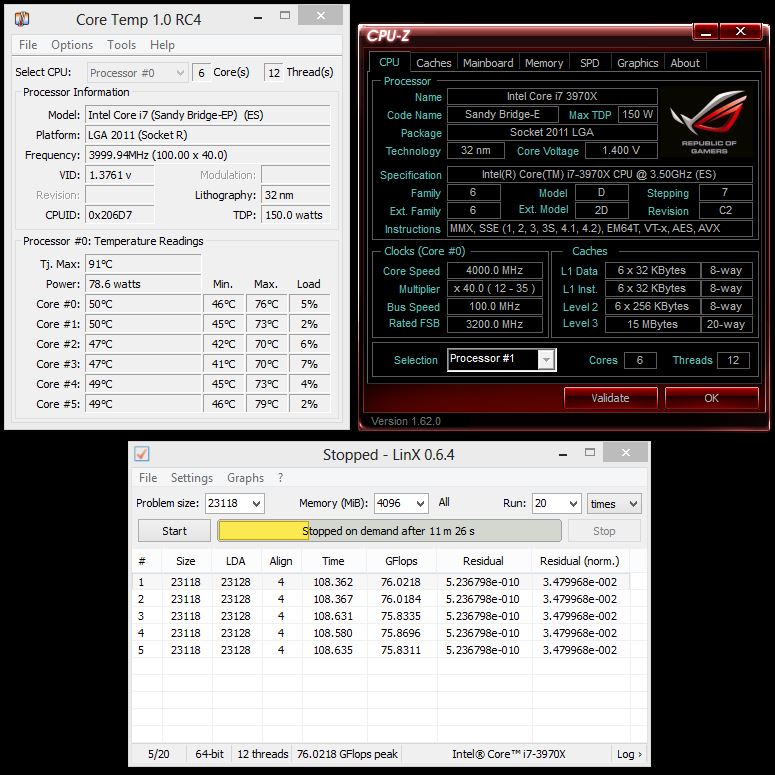
Here is our baseline, the stock Core i7-3970X. We got a max temperature of 79C, with an average full load of 73.5 degrees Celsius across all 6 cores. An average of 44.16C was measure for idle temperatures at an ambient room temperature of 24C.
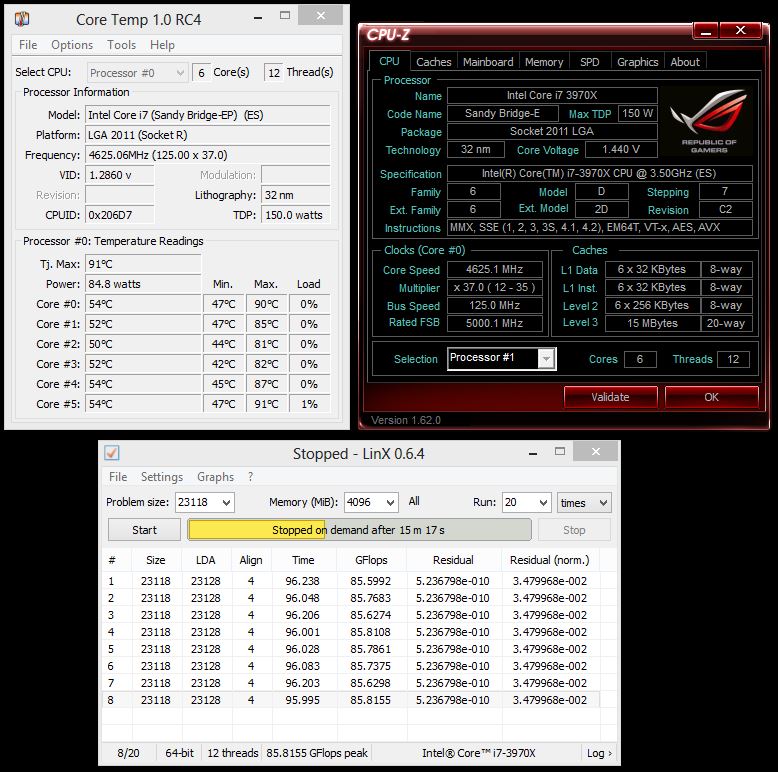
After doing some overclocking, we managed to find the limit of our Thermaltake Frio OCK CPU cooler for this particular processor. With its initial high TDP, it makes it very difficult to push this processor beyond 4.625 GHz without reaching the Tj. Max temperature of the processor. After the Tj. Max temperature is reached, the processor will automatically downclock itself to prevent damage to the processor. While this never happened at 4.625 GHz, we did reach the maximum temperature of 91C on one of the cores with an average temperature of 86C on all cores. Do keep in mind that LinX does push the processor further than a real-life application would, so 4.625 GHz might just be a perfect overclock without actually hitting the Tj. Max limit on the processor while running other applications at 100% load. It is important to keep in mind that temperatures can vary between winter and summer, so while temperatures are fine during the winter, it is likely that temperatures would rise to dangerous levels during the summer.
POWER CONSUMPTION

Cinbenench R11.5 was ran to measure the power consumption of the processors. Because Cinebench perform 3D rendering that 3D or CAD applications perform, we found it to be an ideal application to use for power consumption testing, because most users running such configurations will most likely be working with CPU intensive applications that can fully utilize as many threads as available by the system. We ran the multiprocessor test for measuring full load for the CPU, and left the system idling at the desktop for a few minutes before measuring idle power consumption of the system.
| Power Consumption | Idle | Load |
| Intel Core i7-3960X | 118 Watt | 278 Watt |
| Intel Core i7-3970X | 126 Watt | 291 Watt |
| Intel Core i7-3970X @ 4.875GHz | 164 Watt | 419 Watt |
There is definitely an increase in power consumption when it comes to the i7-3970X. This comes at no surprise, because we do know that the i7-3970X is more of a manufacturer’s overclock rather than a redesign of the actual chip. With a higher Thermal Design Power, we also expect more heat and more power consumption. Once we overclocked the processor to 4.875 GHz, the actual Load power consumption increased by over 120W. This was quite shocking but not unheard of in the overclocking world.
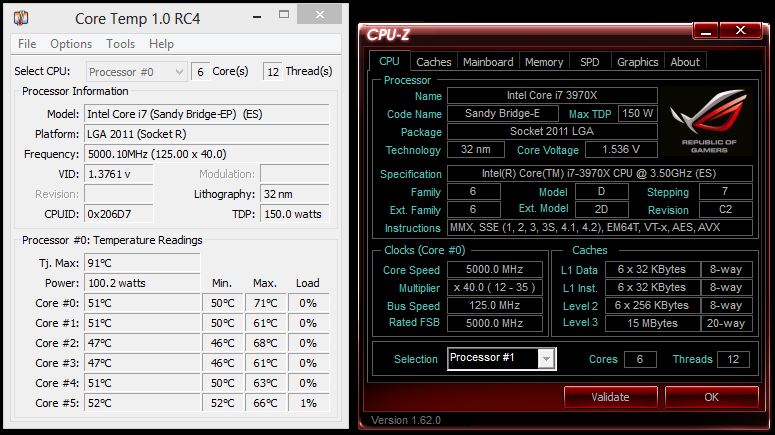
Overclocking

Finally, we went along and used LinX to do our overclocking stress testing, just like we have used it for our Temperature testing. At 4.75 GHz, the i7-3970X downclocked itself at full load on air. A more powerful cooling solution, such as Dual or Triple radiator water cooling system is necessary to keep the processor cool at such clock speeds. We did manage to boot our system without any issues and run it stably with our benchmarks at 5GHz without actually adjusting any voltage settings on the motherboard. This just shows us that the i7-3970X can handle whatever you throw at it as long as your running the processor in the right hardware.
With better cooling, and voltage tweaking, we know for sure that higher clock speeds can be stabily achieved with this processor. The Core i7-3960X is also a great processor, but we did not have as much luck overclocking it as we had with the i7-3970X. It is possible that we just got lucky and our 3970X is handling overclocking especially well over the other processors.
Conclusion
The Intel Core i7-3970X is no doubt the fastest desktop processor out on the market, but is it a big leap from the i7-3960X? Our testing has shown only a small increase in performance, which is expected with the 200 MHz performance boost that we get with the 3970X. With AMD lagging behind and shifting their focus from the performance desktop CPU market, Intel doesn’t necessarily feel the need push forward with newer architectures. The i7-3970X does not come with a 22nm manufacturing process, so we’re still looking at the same 32nm chip as we saw on the original i7-3960X way back in November 2011, with a slight so called “manufacturer-overclocking”. Ivy Bridge entered the market with the first 22nm chip, which was of course more energy efficient, and with Haswell coming in as the 2nd generation optimized 22nm process microprocessors, we’re not seeing anything new on the enthusiast side that would blow us away. As we know, Haswell won’t be the next enthusiast platform, which makes us worry as to when will we actually see Ivy Bridge-E, which should be the next replacement for the Sandy Bridge-E processor family.
On the other hand, the Intel Core i7-3970X did impress us in performance. While the i7-3970X Extreme Edition processor might not be for those already running the i7-3960X, it would be an excellent processor for those thinking about upgrading to a X79 chipset system running the LGA 2011 socket processors. The i7-3960X and i7-3970X will always be a great option for users that need quick processing of resource-demanding tasks, but the i7-3970X should definitely be on your list over the older i7-3960X model. With only a $10 difference in price, the i7-3970X would provide better performance that would save you time and money in the long run, while it also seems to provide a slightly better overclocking and stability over the previous i7-3960X chip. It is important to understand that a powerful cooling solution will be needed to keep this beast cool, as we have seen in our testing; a small overclock can easily heat up the processor to high temperatures which in the end would result in poor performance due to down-throttling.


If there is a reason to buy either chip I haven’t come across a reasonable one yet?
Understandable. These chips will be intended for mainly professionals working with multithreaded applications like CAD software, video and photo editing, simulation software, etc. Gamers are well off with Ivy Bridge and Sandy Bridge.
I disagree. The 3930K was intended for people who need high performance, multithreaded power.
The 3960X and 3970X were intended for people with too much money.
CAD actually is single thread.
There are some applications which can take advantage of the larger cache available on the chip, but most users are as the name states *Extreme* myself included means were usually pushing them to the absolute edge, and every small bit of performance is being pulled form it… in that case compromise or “good enough” simply wont do….
also there are many apps that run multi-threaded and will see a benefit from the increased cache although many are productivity apps used by content professionals.
Not to mention nobody needs a Ferrari to drive anywhere ever…. but if you can you do… Its not necessarily about having too much money as it is about choosing what you want. If you feel the K is enough for what you need then awesome, get it…
for only $10 difference? I think that puts i7-3960x very much inferior…