Nvidia GeForce GTX 650 Ti Boost – The Missing Link in the Mainstream Lineup?
Testing & Methodology
We’ve expanded our testing suite considerably since the X79 chipset release, and will continue to use the same methods for most of the motherboards and CPU’s we test. In the interests of thoroughness and accurate results, we run each test at least three times, and some tests more than that. We average the total of all the tests from each benchmark then report the average here.
The OS we use is Windows 7 Pro 64bit with all patches and updates applied. We also use the latest drivers available for the motherboard and any devices attached to the computer. We do not disable background tasks or tweak the OS or system in any way. We turn off drive indexing and daily defragging. We also turn off Prefetch and Superfetch. This is not an attempt to produce bigger benchmark numbers. Drive indexing and defragging can interfere with testing and produce confusing numbers. If a test were to be run while a drive was being indexed or defragged, and then the same test was later run when these processes were off, the two results would be contradictory and erroneous. As we cannot control when defragging and indexing occur precisely enough to guarantee that they won’t interfere with testing, we opt to disable the features entirely.
Prefetch tries to predict what users will load the next time they boot the machine by caching the relevant files and storing them for later use. We want to learn how the program runs without any of the files being cached, and we disable it so that each test run we do not have to clear Prefetch to get accurate numbers. Lastly we disable Superfetch. Superfetch loads often-used programs into the memory. It is one of the reasons that Windows occupies so much memory. Vista fills the memory in an attempt to predict what users will load. Having one test run with files cached, and another test run with the files un-cached would result in inaccurate numbers. Again, since we can’t control its timings so precisely, it we turn it off. Because these four features can potentially interfere with benchmarking, and and are out of our control, we disable them. We do not disable anything else.
We are revamping our testing method in order to better represent performance and value offering to the consumer. Also we want to make it an easier read for you without miles of endless charts. We ask that you provide feedback in an effort to help us deliver better reviews for you.
Test Rig
| Test Rig | |
| Case | Open Air Test Bench |
| CPU | Intel Core i7-3770K |
| Motherboard | ASUS Maximus V Formula |
| Ram | 16GB Patriot Viper Xtreme 2400MHz + |
| CPU Cooler | Swiftech H20-320 Edge |
| Hard Drive | Western Digital Velociraptor 300GB |
| SSD | Intel 510 series SATA III 120GB |
| Optical | ASUS BD-ROM |
| GPU | Nvidia GeForce GTX 650 Ti Boost |
| Additional Cards |
N/A |
| PSU | Thermaltake Toughpower XT 1475W |
| Mouse | Tt eSPORTS Theron gaming mouse |
| Keyboard | Tt eSPORTS Meka G1 mechanical gaming keyboard |
Test Suite
We will use the following applications to test the performance of the graphics card.
Synthetic Benchmarks & Games
| Benchmarks |
|---|
| 3DMark11 |
| Batman Arkham City |
| Battlefield 3 |
| Dirt 3 |
| Heaven Benchmark |
| Just Cause 2 |
| Lost Planet 2 |
| Metro 2033 |
Overclocking

The GTX 650 Ti Boost card now utilizes the GPU boost feature which means when you overclock you are setting the desired boost clock and the base GPU clock changes in fashion. However the maximum GPU clockspeed will still modulate according to thermal and power parameters which can only be controlled to a certain percentage.
The GPU power target can be adjusted up to 10% over stock. The maximum GPU clock observed was a setting of 1150 base/1200 Boost which allowed for a dynamic clock of up to 1242, anything above this would cause small instances of instability.
Memory frequency was able to be adjusted quite a bit as well as we were able to get it up to 6900MHz which is quite good, and we’re sure some samples may even go further. Not to mention that many board partners will have optimized designs and VRM’s to support further clocking and we’re betting with that you will also see even more from it.
The Overclocking on this card allowed for 16% increase on the core and 15% on the memory which is nothing to scoff at as it allows for even more performance from an already capable value card.
In order to ensure no system bottleneck we clocked the CPU to 4.6GHz to ensure there is no reason the system will slow down the card’s performance at all.
Some may ask why we chose the mainstream Z77 system, and we can explain. Up until recent the X79 enthusiasts platform did not really support PCI-E Gen 3 on the Nvidia 600 series GPU’s. Because of the inherent instability many have seen with the X79 platform with Gen 3 products, Nvidia has been hesitant to enable it, and now there is a workaround via registry to get it working. However, in order to ensure the most consistent testing possible, we have stuck to the natively supported Z77 platform.
Important note: Overclocking can cause component failure. Please exercise caution when attempting any level of overclock on system components.
Temperatures

The temperatures were recorded with full loaded Heaven benchmark looping for over 30 minutes or longer depending how long it took for the card to level out in temps and sat at a plateau for more than 10 minutes.
| GPU Temperatures | Temperature (Idle/Load) |
| GTX 650 Ti Boost OC | 31C/74C |
| GTX 650 Ti Boost | 31C/65C |
The cooler on the GTX 650 Ti while it may not be anything spectacular does the job and keeps the GPU in check even when churning along at 1200 Core clock. We cannot wait to see what the aftermarket coolers employed by the GPU vendors such as ASUS, MSI and Gigabyte can do when pushing the card to its limit.
Real world/Gaming Benchmarks
3DMARK 11
![]()
3DMark 11 is the newest in Futuremark’s suite of benchmarking utilities. Its a fully capable DirectX11 benchmark which also stresses and analyzes the system performance as a whole to simulate a heavy rendering environment such as a high end game or other app the end user may run. This benchmark was run with Performance settings 5 times and all runs were averaged for the result below.
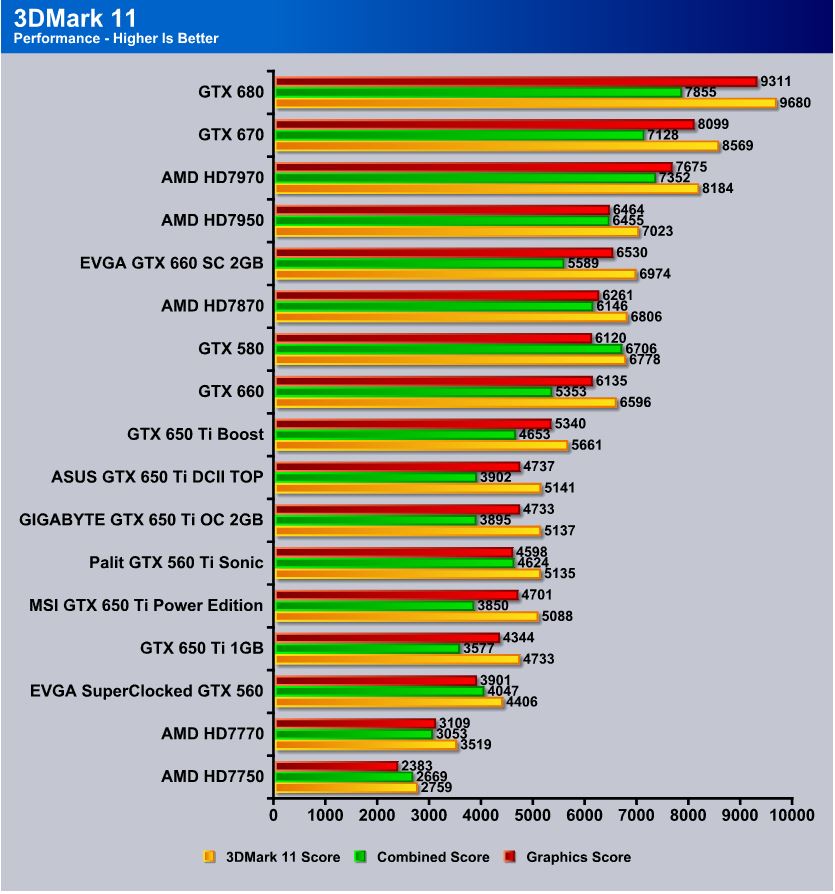
Here we have it and the GTX 650 Ti takes a nice lead above the GTX 650 ti and bridges the gap between the 650 Ti and GTX 660 part.
Batman Arkham City
Batman Arkham city is one of those games that is just downright fun, and also it is nice as it gives very repeatable results for a game test. PhysX is disabled to level the playing field due to the fact that it would load the GPU on Nvidia based cards more to add the pretty effects which could hinder framerates giving AMD an advantage.
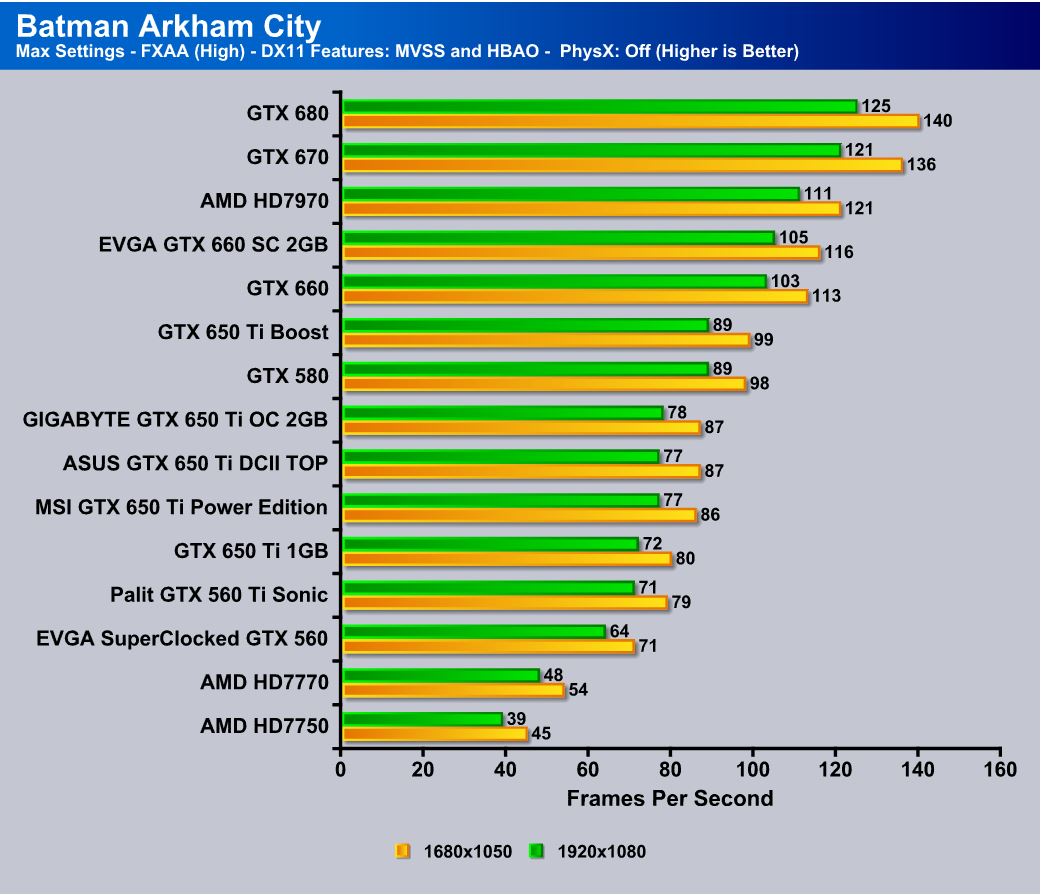
Here we see the GTX 650 ti Boost takes a nice lead even eclipsing the Previous gen flagship GTX 580 card which is quite the feat considering this is a mainstream performance model, and only a fraction of what the 580 was at launch.
Dirt 3
Dirt 3 is a pretty popular racing simulation mixing many offroad environments along with sometimes just simple smashup racing with very nice visuals.
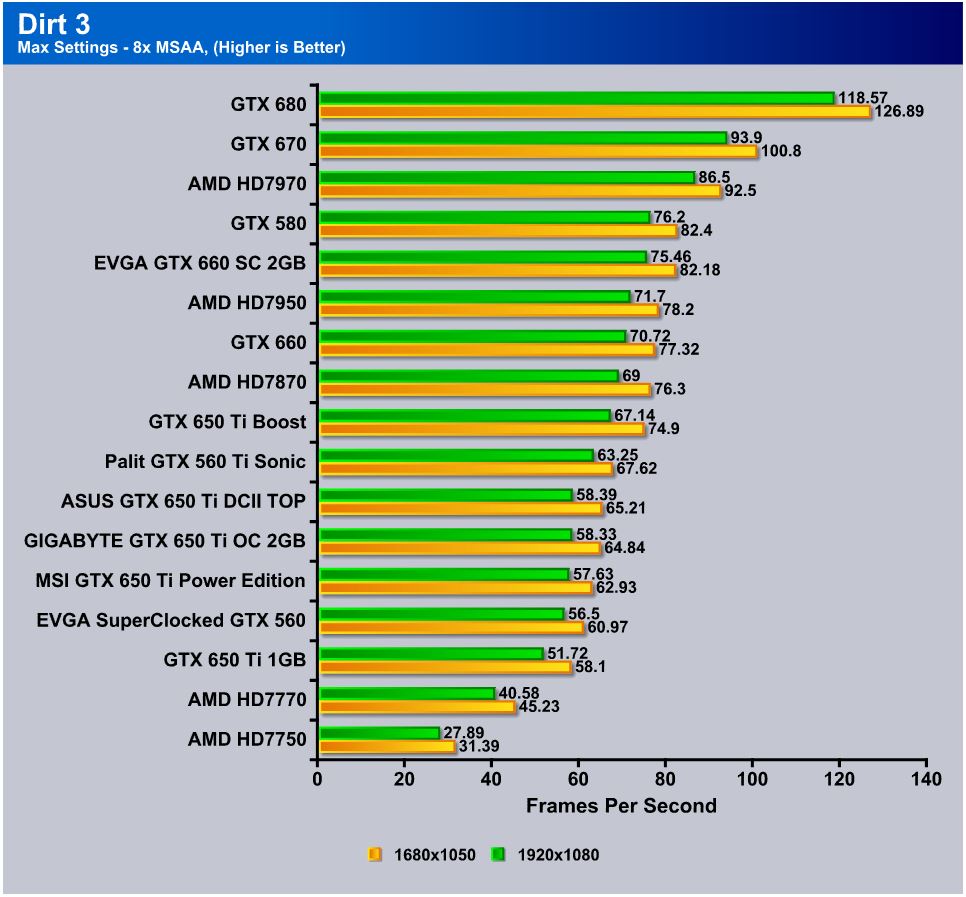
Here the 650 Ti Boost is on the heels of the 7870 which is awesome considering by design the 650 Ti Boost is actually setup to content with and beat the 7850 model.
Just Cause 2
Just Cause 2 has been in my stable of games for awhile, and is quite graphics intensive so I try to bring it out as it is a fun all around game and allows a nice test of a cards capabilities.
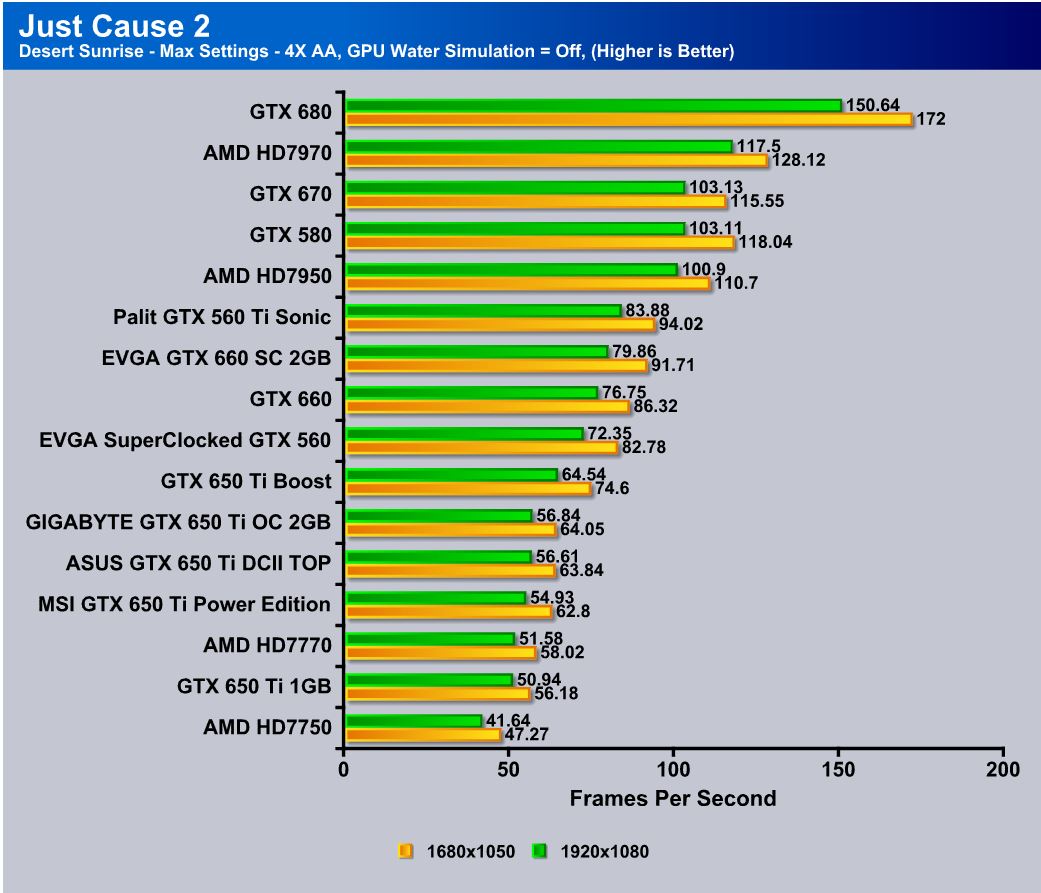
Here the GTx 650 Ti Boost falls off a bit but still easily beats the standard GTX 650 Ti model. We are interested in what future driver revisions will offer in terms of performance as it is optimized.
Lost Planet 2
Lost planet 2 even for being a bit older tends to offer a very good load even keeping top end GPU’s capped at a little over 60 FPS so it is definitely a good tool to put the hurt on a more mainstream value card.
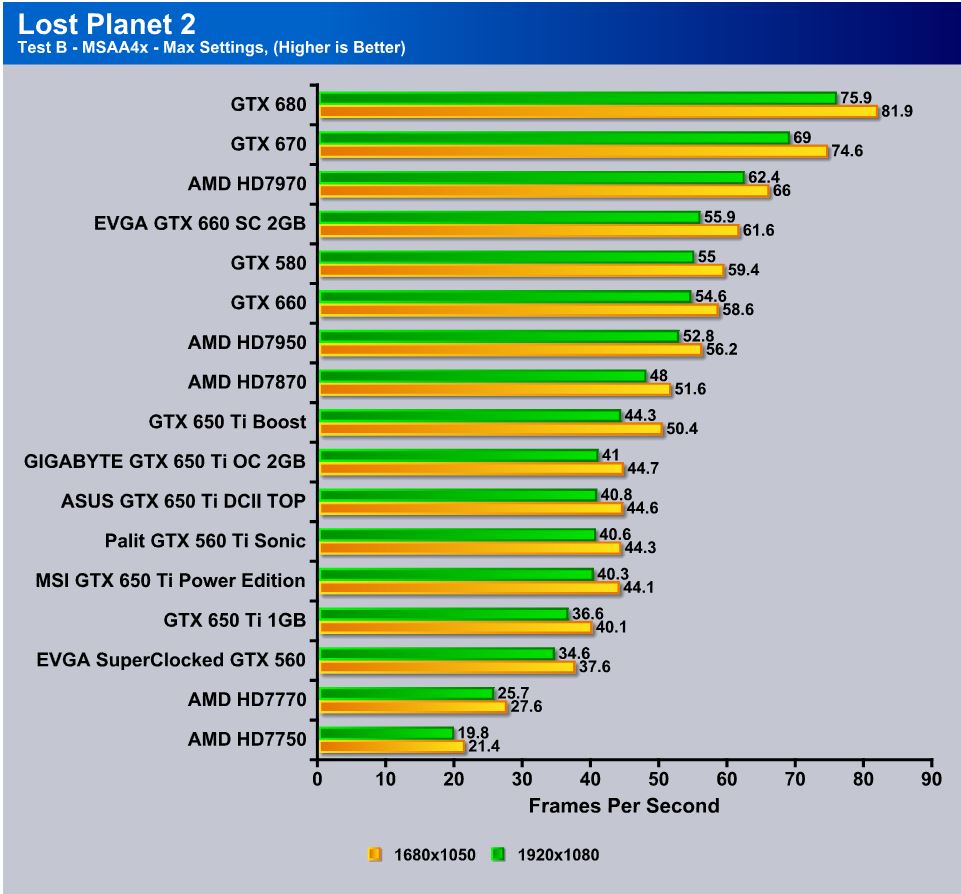
Lost Planet 2 shows great performance again as it comes within 8% of the HD7870 model and with overclocking im betting it could surpass it. Should be interesting to see how the overclock models from manufacturers fare in terms of performance.
Metro 2033
![]()
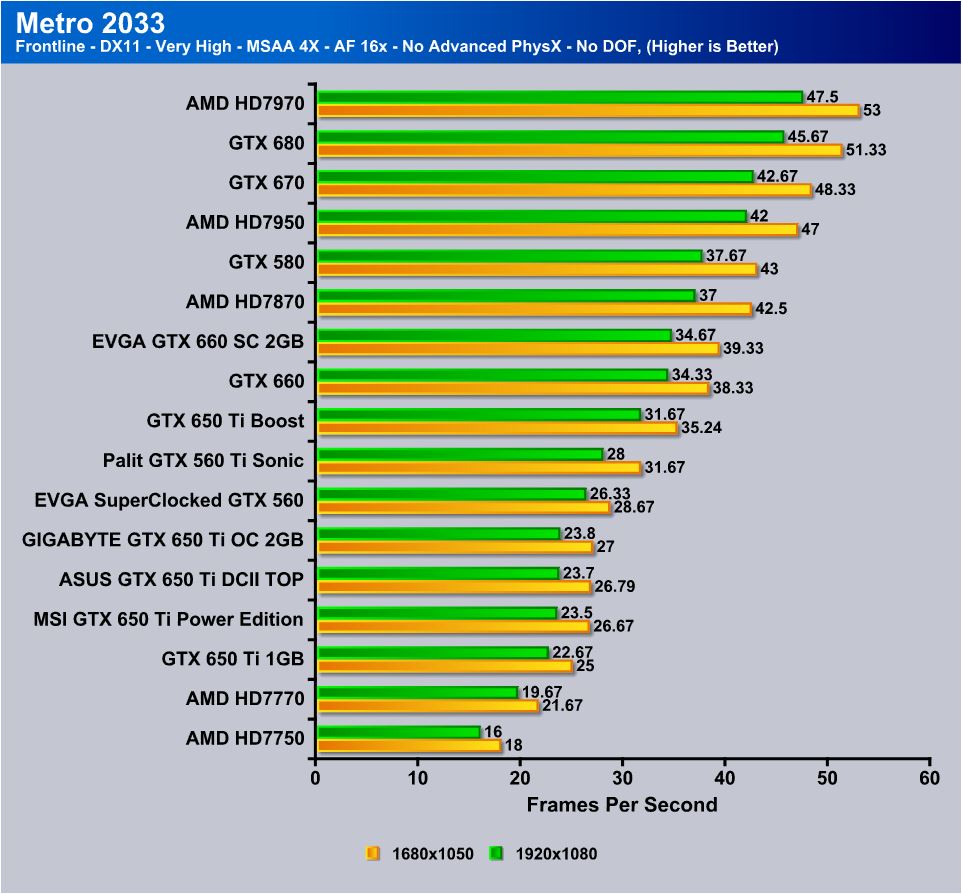
Metro 2033 likely one of the most demanding games that we have tested with, as it brings virtually every GPU to its knees. Here the Boost card shows pretty playable average framerates at over 30 FPS while the standard 650 ti pulls mid 20’s which means that at HD resolution gaming is now a possibility with the new 650 Ti Boost
Heaven Benchmark
Unigine Heaven is a very popular benchmark, but due to the fact I am still working on validating the repeatability of scores on the new 4.0 version I decided to stick with the 3.0 version for this test.
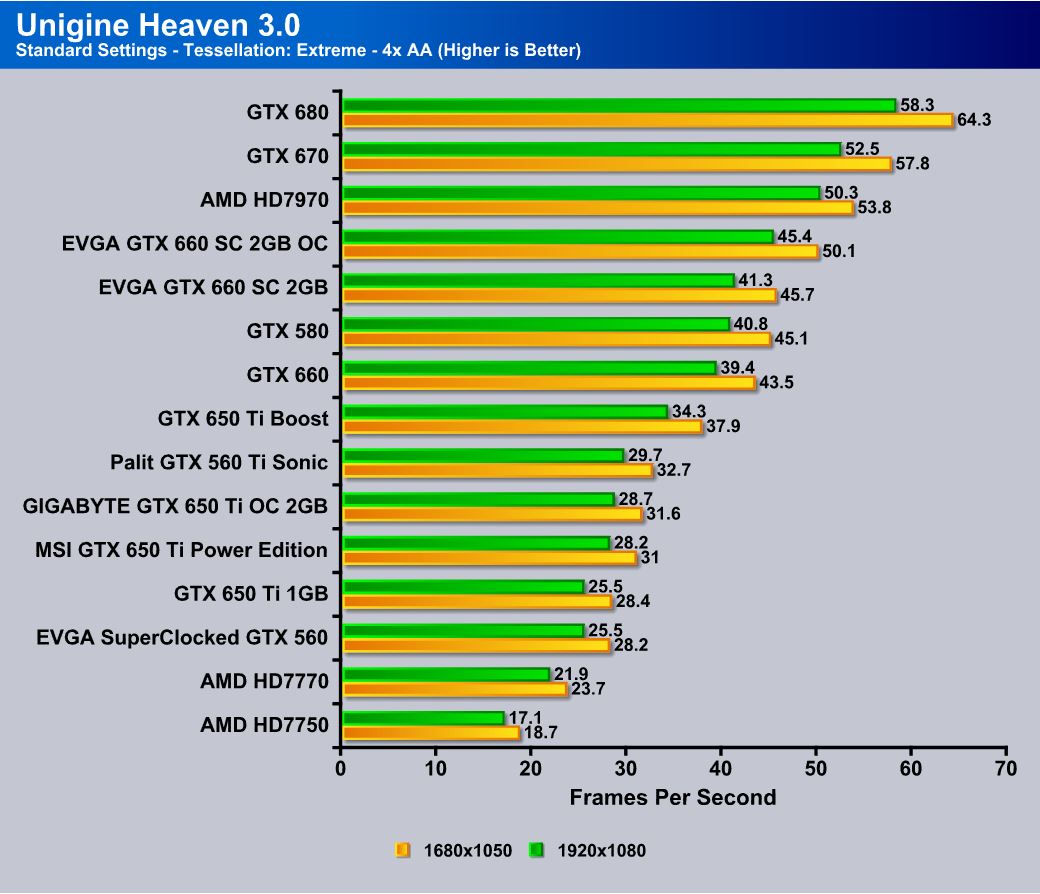
Here the GTX 650 Ti Boost pulls fair numbers but Heaven is a very stressful test so seeing mid 30’s is actually quite good especially for a mainstream performance part.
Battlefield 3
Battlefield 3 is probably one of the most popular FPS titles, and with its range of graphics capabilities definitely a fitting test as it also is played by a alrge part of the PC Gaming crowd.
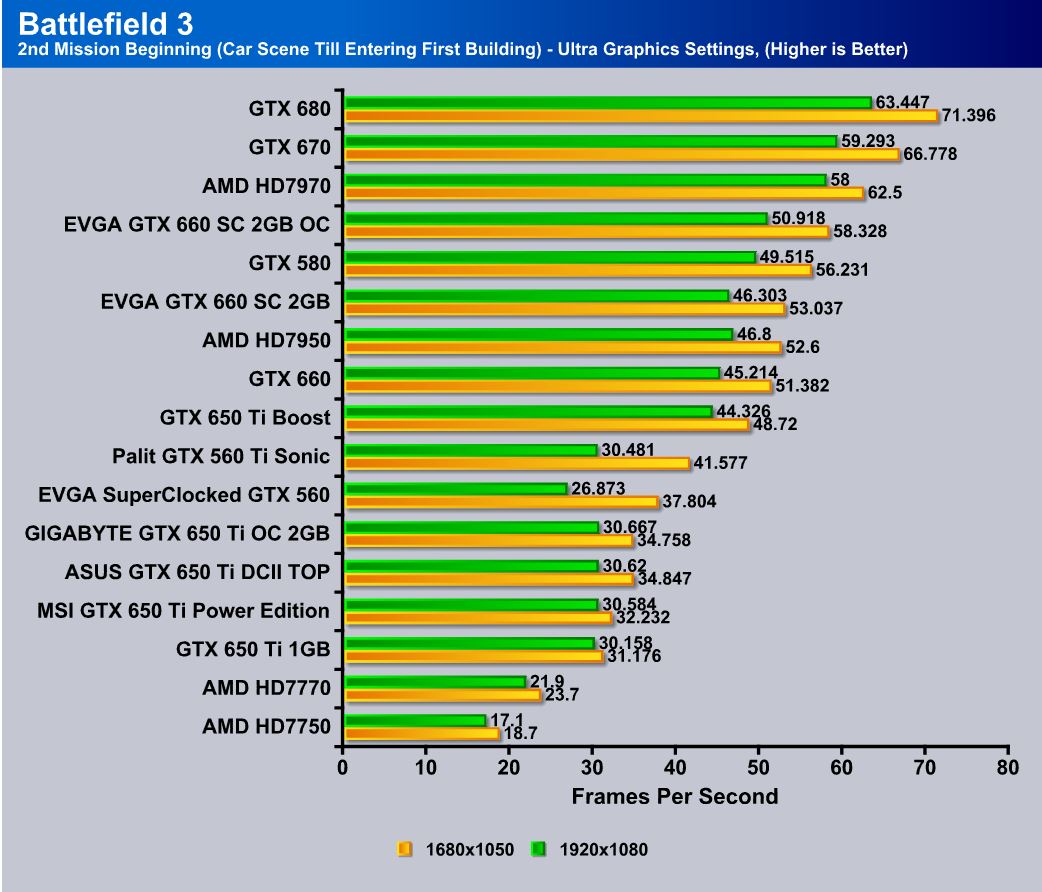
The GTX 650 Ti Boost pulls mid to high 40’s in FPS in battlefield which is very good considering this is at Ultra settings. With the high settings I am betting that 50+ FPS would be pretty consistent. Honestly that is the target from Nvidia to begin with but for sake of continuity all are tested at the same settings.


I would add SLI support in “Pros”.
good point… and I thought I did…. thanks for the catch dude… Also keep eye out for SLI review soon… 🙂 lets see how the budget cards scale.