TESTING & METHODOLOGY
To test the drive, we cloned our test rig drive to the SSD. It is the same test drive we’ve been using on all of our drive testing and is nothing more than a clean Windows load with all the drive testing software installed, as well as all the current drivers and patches for the OS. It’s the equivalent of doing a fresh load of OS from the disc but takes a lot less time and ensures that every drive tested uses exactly the same OS load and drivers. Nothing that may effect the outcome of the testing procedure can creep in. We ran all of the tests a total of 3 times and averaged those results. The Average of the three results are presented here. In the case of a pictorial benchmark we ran the bench 3 times and picked the median result. As with most SSD testing differences from run to run are minimal and the median result is a good indication of what you can expect from the drive. We ran our usual battery of tests on the drive, and used it as the primary boot drive during testing. All of the drives tested were used as the primary boot drive during testing. That’s a more realistic test than strapping the drive in and testing it with a bare format or as a non-boot drive and it represents real life transfer rates, much like you can expect when you install and operate the drive in your own system. Each test was performed 3 times and the average of the 3 test run is reported here.
Test Setup
| Test Setup | |
| Case Type | None |
| CPU | Intel Core i7 3770K |
| Motherboard | Gigabyte GA-Z77-UD3H |
| Ram | Kingston HyperX 1600 |
| CPU Cooler | Prolimatech Megahalem |
| Storage Drives |
|
| Optical | None |
| GPU | PNY GTX 670 |
| Case Fans | 120mm Fan cooling the mosfet CPU area |
| Docking Stations | None |
| Testing PSU | Cooler Master UCP 900W |
| Legacy | None |
| Mouse | Microsoft Intellimouse |
| Keyboard | Logitech Keyboard |
| Gaming Ear Buds | None |
| Speakers | None |
Iometer
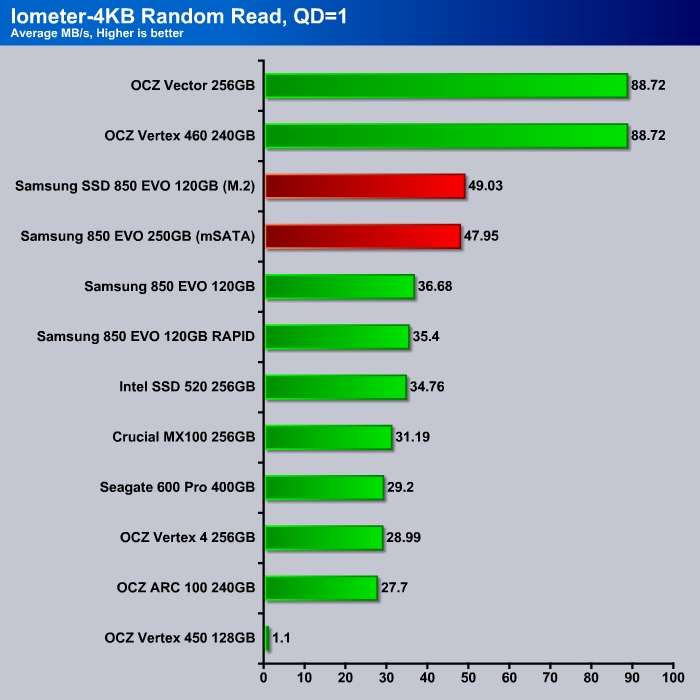

The random read for the mSATA and the M.2 is about 30% higher than the SATA drive. The 850 EVO is essentially the fastest drive on the market today for the consumer SSDs when comes to random read, an area where users would most likely notice when loading applications.
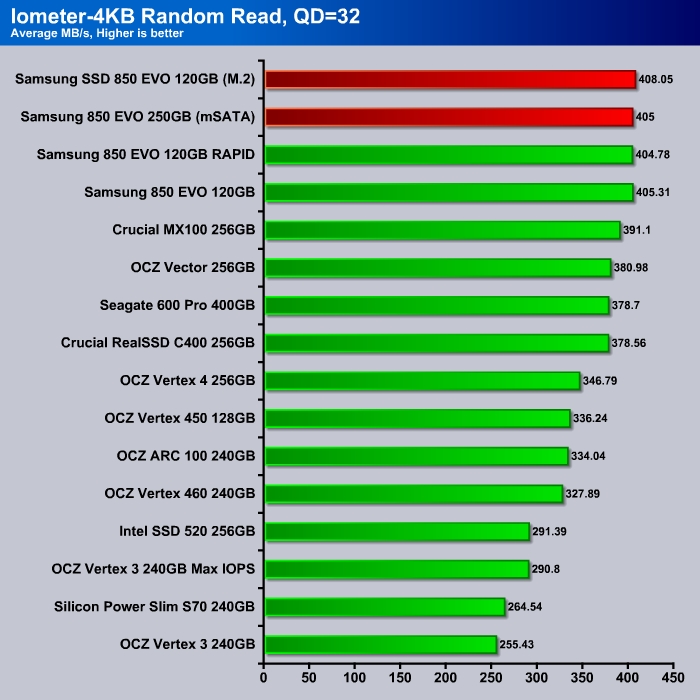
The 850 EVO dominates the higher queue depth read performance.


Random write at queue depth of 1 shows about 10% improvement but at typical desktop workloads of queue depth of 4, we see that the 120GB M.2 and the SATA drive delivers same performance with 155 MB/s. The 250GB M.2 delivers 296 MB/s which is up there with other 250GB drives.
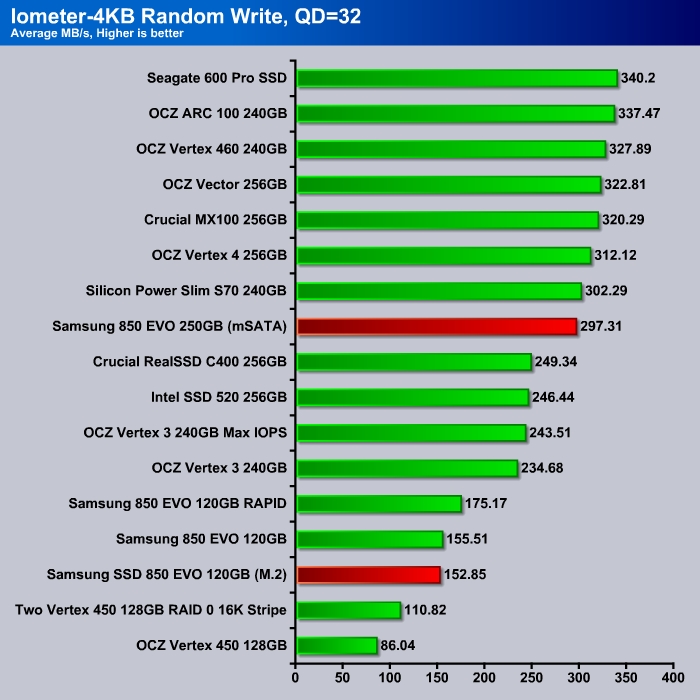
The 850 EVO again delivers excellent performance at queue depth of 32. While there are a few drives yield higher rate, it is unlikely that a typical desktop workloads would ever reach such high queue depth.
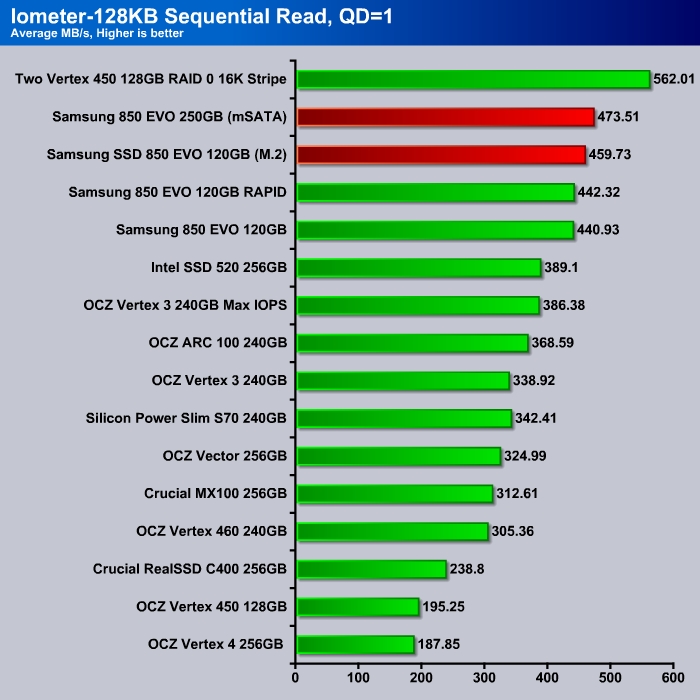
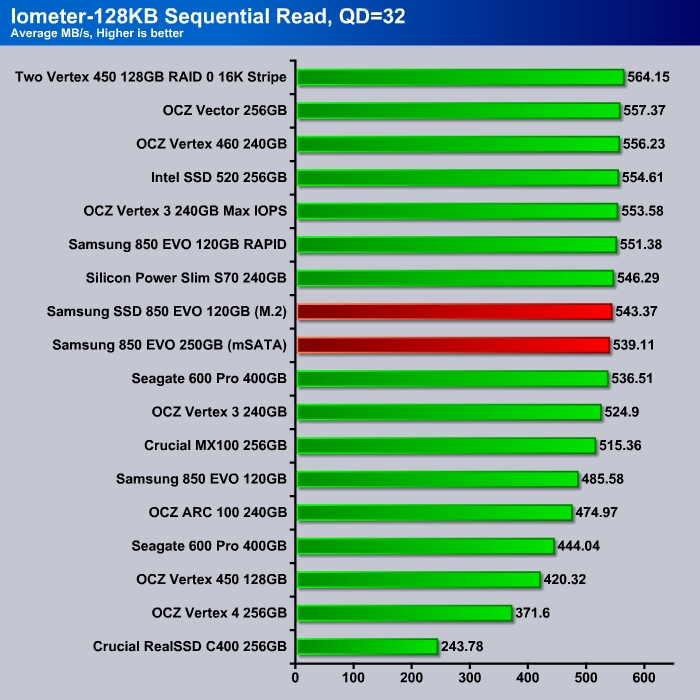
The 850 EVO is no slouch when comes to sequential read as you can see that even the 120GB drive is able to keep up with the higher capacity drives.
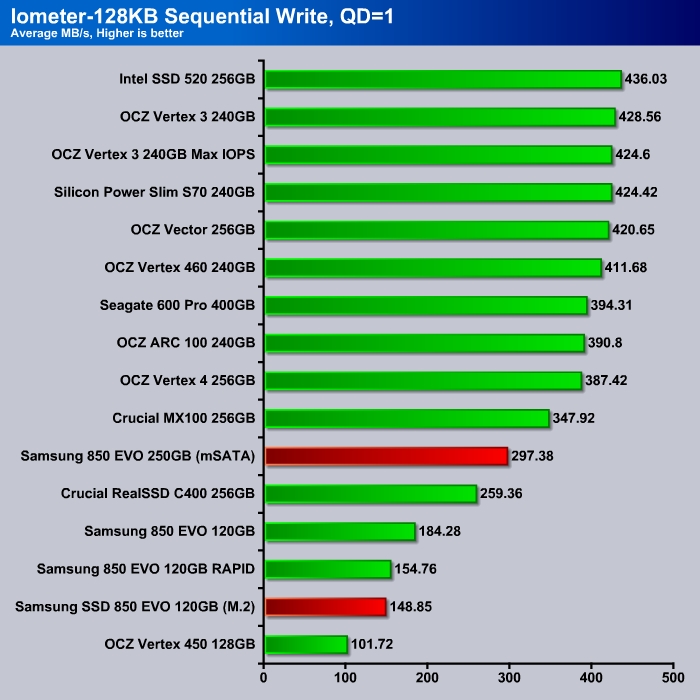
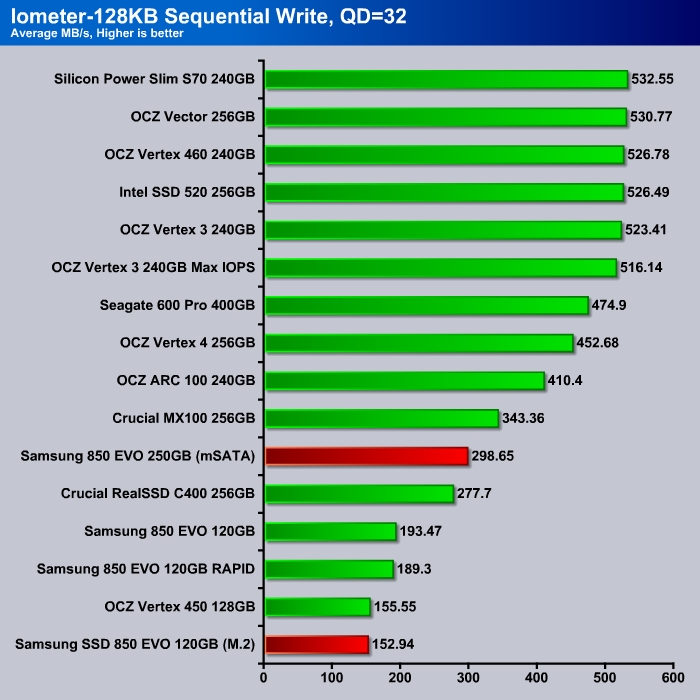
If there is an area where the 850 EVO is lagging slightly behind the competitor would be the sequential write. while the 120GB drive is relatively fast compare to the competitor with 150 MB/s. The 250GB drive delivers 300 MB/s, which lags slightly behind other 250GB drives. Keep in mind that the result we are looking at here is the non-TurboWrite, with TurboWrite, we should expect higher performance.
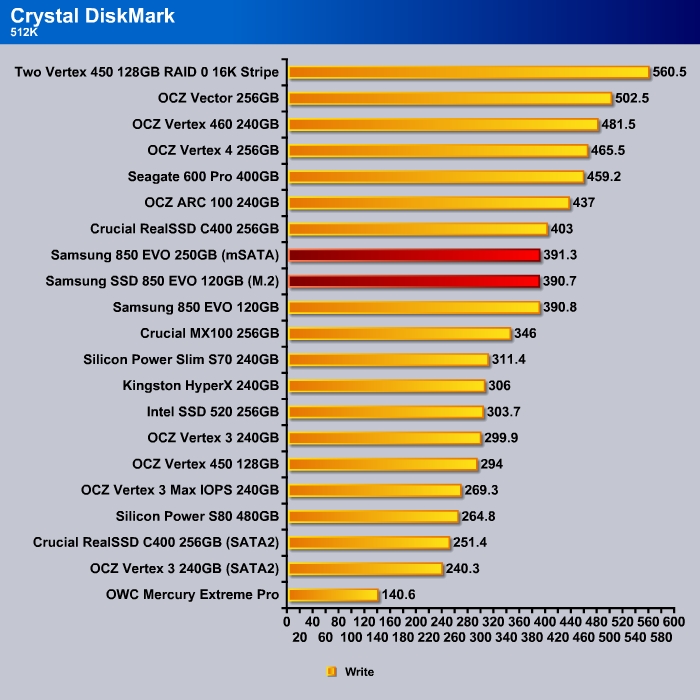
Crystal DiskMark 3.0.3 x64

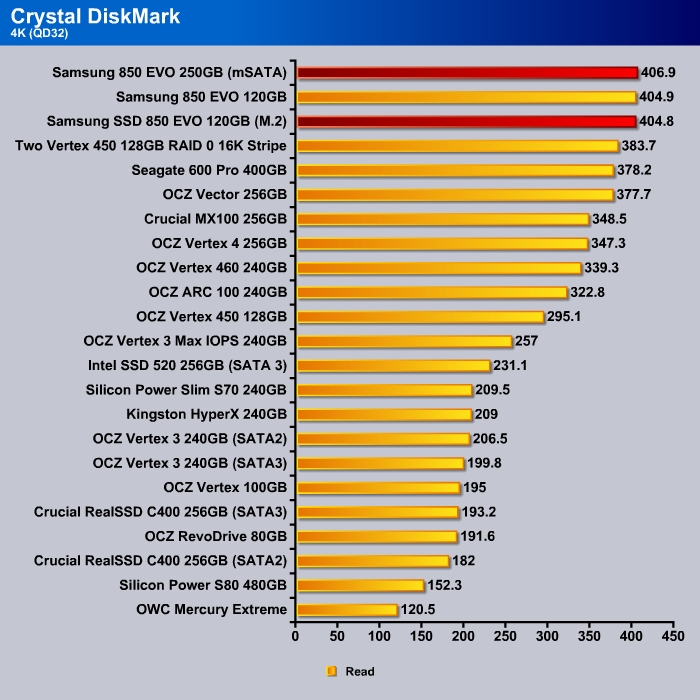
The 850 EVO excels in the random read department here.
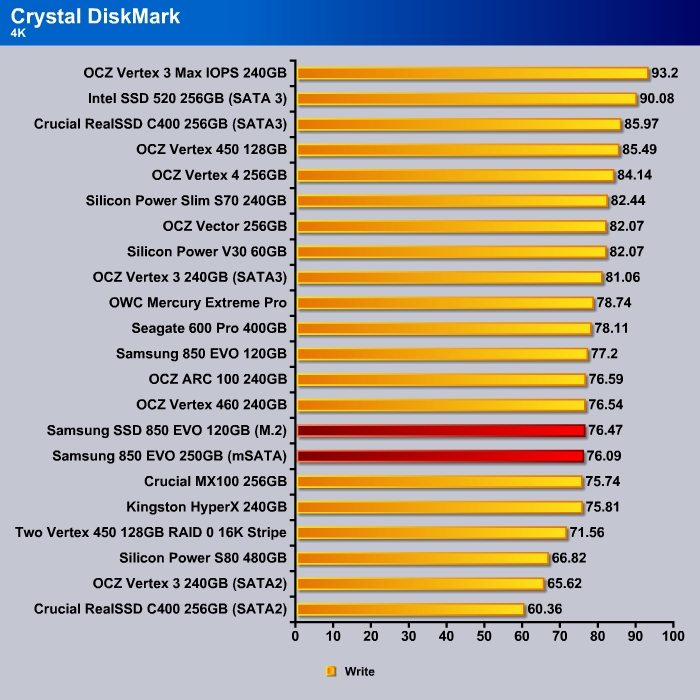
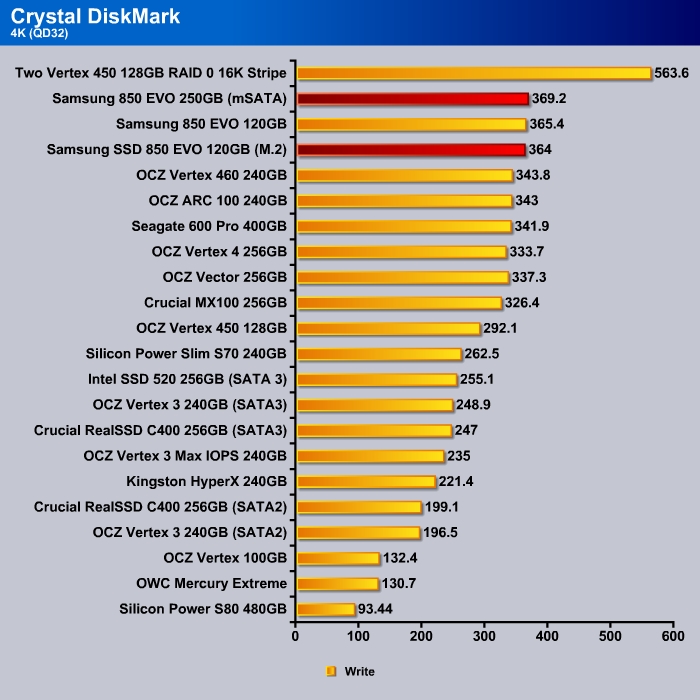
The random write for the 850 EVO is relatively consistent regardless of the storage space. Thus, we can see the 120GB mSATA to have the same result as the 250GB M.2.
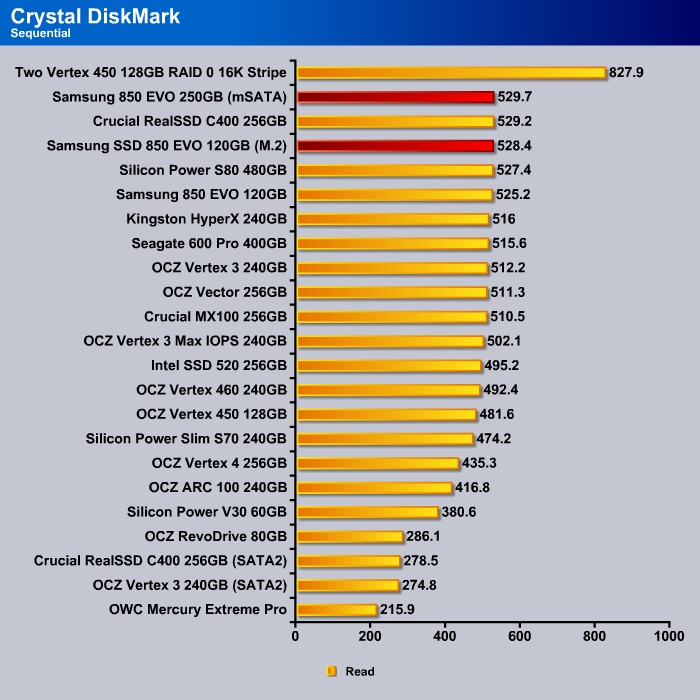
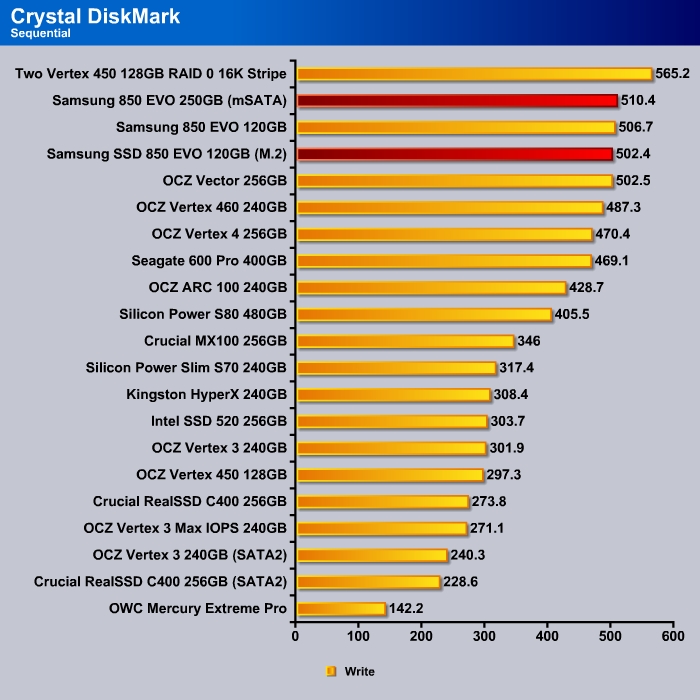
The 850 EVO does well in the sequential read and write department. The Crystal DiskMark shows us the best case scenario with the TurboWrite enabled. Since we are testing with 1GB of data written to the drive which is less than 3GB of reserve space on the 120GB drive and 6GB reserve space for the 250GB drive, we can see that the drive writes at Turbo speed of 500 MB/s.