Performance
We are mainly interested in three areas when it comes to performance: transfer rate (MB/s), Input/Output Operations per second (IOPS) and latency.
Transfer rate probably is the easiest to understand as it measures the amount of data the drive can handle per second. IOPS on the other hand is a bit more complex. An I/O operation is simply some kind of work the disk subsystem has to do at the request of a host and/or some internal process. This could be a read or a write which by itself can be sequential, random and of varying sizes. So measuring IOPS is not exactly easy as it depends on the workload.
Latency (also called access time or response time in some benchmarks) measures how long time it takes to complete a request.
What is more important? Well, it depends on what you are doing with the drive. If you mostly are moving big files then the sequential bandwidth/transfer rate probably is the most important. For example if you have an external hard drive as storage for your 4GB+ movie rips in mkv-format, then you want to have the best transfer speed possible. If you however are using the drive as an OS or application drive, for example installing applications on it, then suddenly it becomes more complex. A lot of the drive operations will now be smaller files (4K is very usual) and read and write over random places on the drive.
We tested the Samsung Storage SSD T1 on our ASUS G550JK laptop (Core i7-4710Q).
Transfer rate

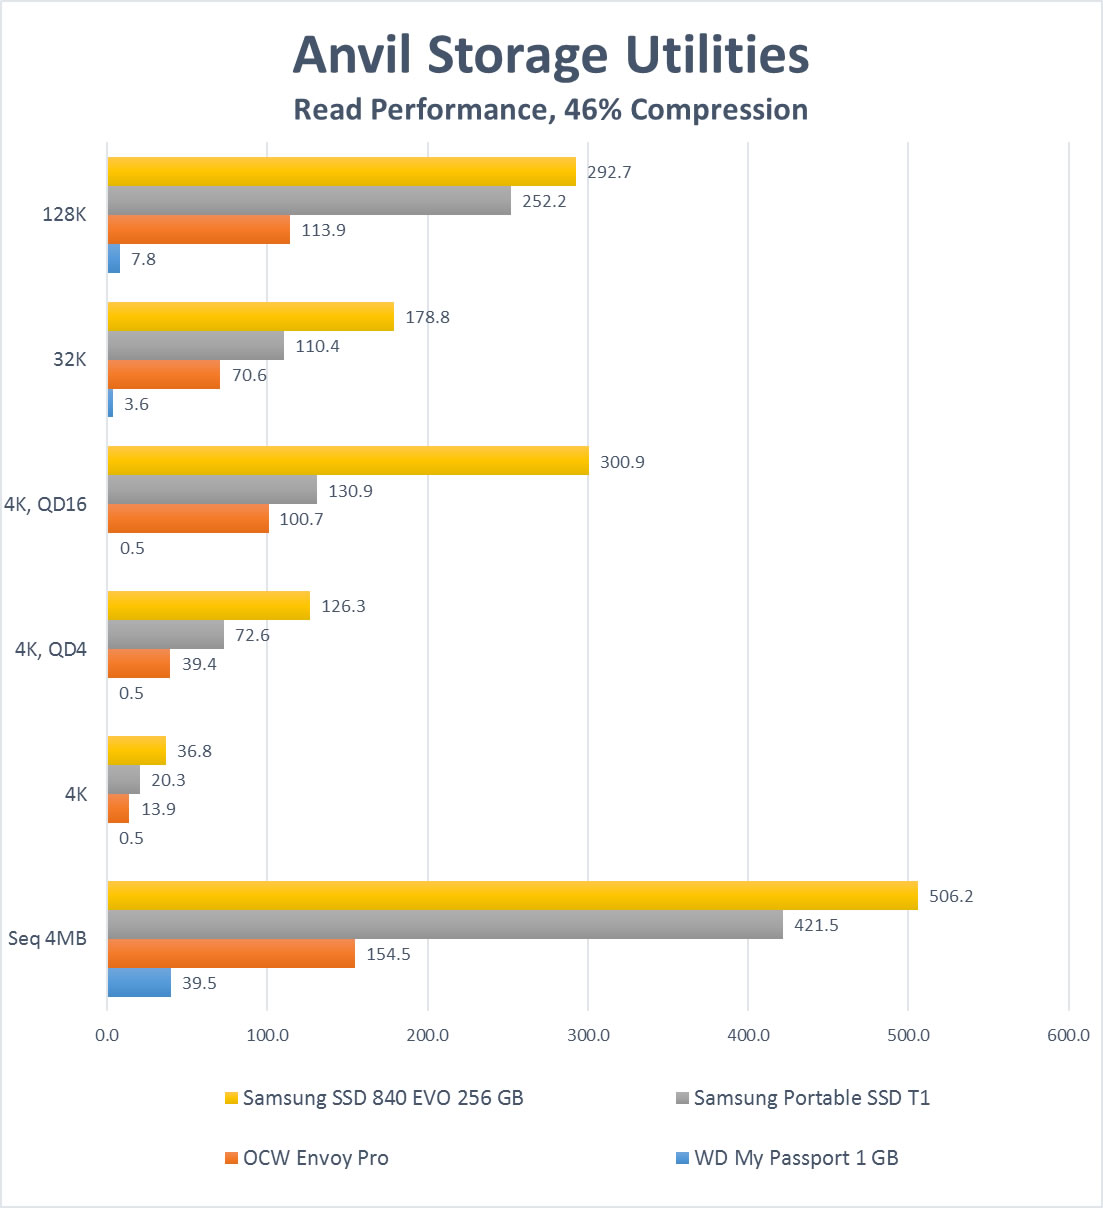
With 100% compressed files we get the raw performance of the drives. The sequential read speed of the Samsung Portable SSD T1 might not reach the internal Samsung 840 EVO but it is a lot higher than the other SSD-based flash drive in the test, the OCW Envoy Pro. The poor WD My Passport Ultra 1 GB falls far behind. As we move to 4K files the difference between the Samsung T1 and the Envoy Pro is not as big but is still there.
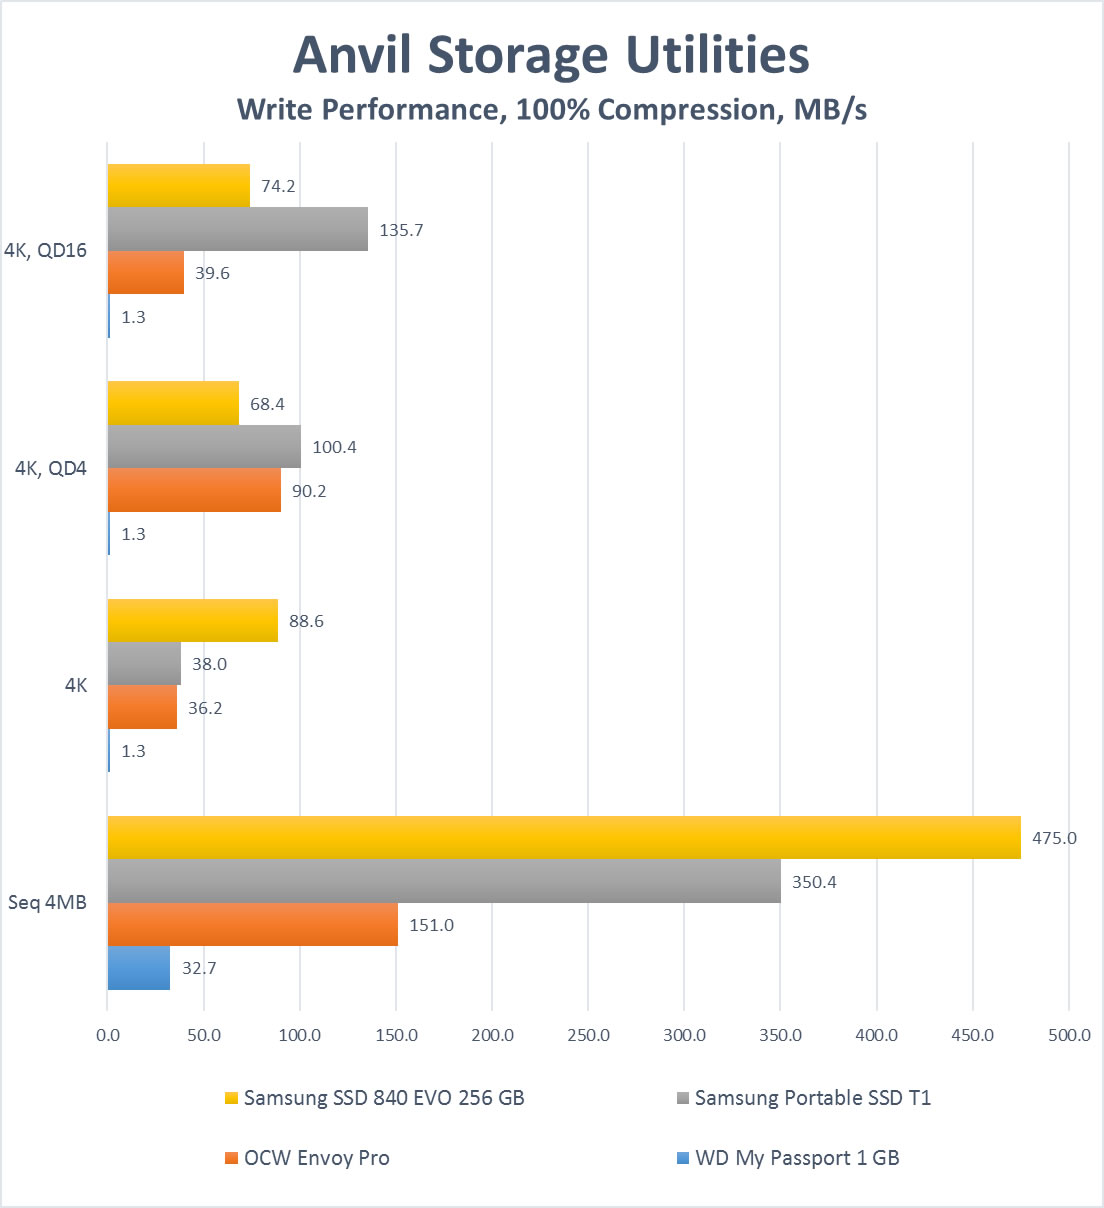
We are not sure what happened to the 840 Evo at 4K with higher queue depth but otherwise we see a similar picture as when looking at read performance. The Samsung Portable SSD T1 impresses with good to great writing performance.
As we switch over to a more real-world mix of compressable and incompressable files the performance order of the drives becomes quite clear. The EVO 840 performs the best followed by the Samsung Portable SSD T1 and then the OCW Envoy Pro which is distanced by quite a lot by the Samsung T1 and dead last the hard drive based external WD My Passport Ultra.

As we switch to the write test while using the “Application”-mix of files the difference between the Samsung T1 and the OCW Envoy pro is not as big except when looking at the sequential transfer rate.
IOPS
We use Anvil Storage Utilities to measure IOPS at different queue depths. Usually you see a QD up to 3-4 in normal use.
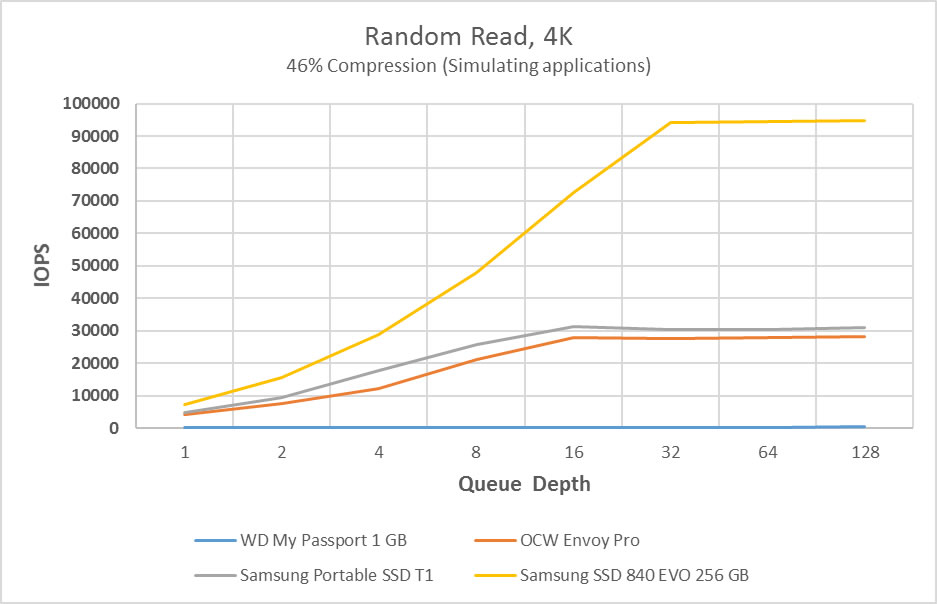
Neither SSD-based flash drives can keep up with the internal Samsung SSD EVO 840 but the Samsung Portable SSD T1 manages to beat the OCW Envoy pro at each Queue Depth.

As we switch to the write-performance the Samsung Portable SSD T1 and the OCW Envoy Pro are much closer together and trade places a few times as the QD increases.
Response Time
We actually left out the response time/Access time for the Wd My Passport Ultra 1 GB as it is at its lowest around 16 ms and then just goes up as we increase the QD. Including these scores in the chart makes it impossible to see the differences between the SSD-based drivers.
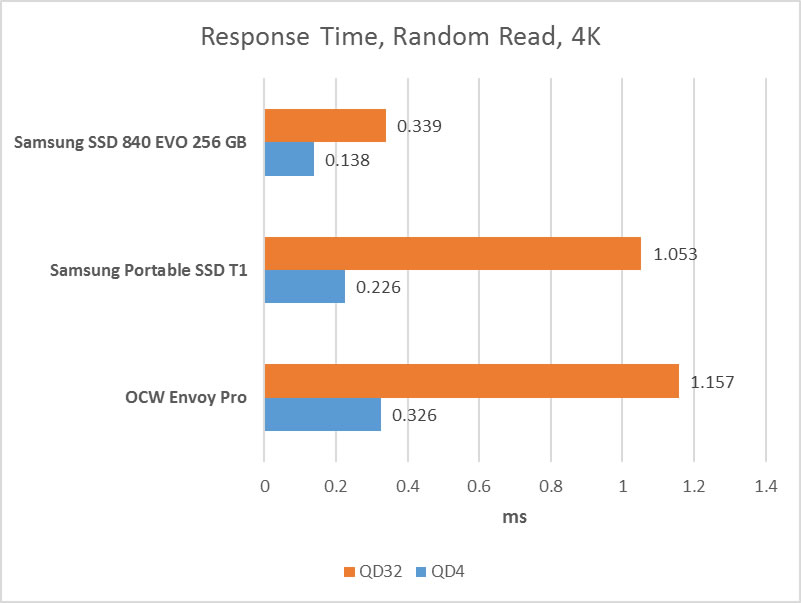
While the Samsung Evo 840 has the lowest Read response time the Samsung Portable SSD T1 manages to beat the OCW Envoy pro at both QD.
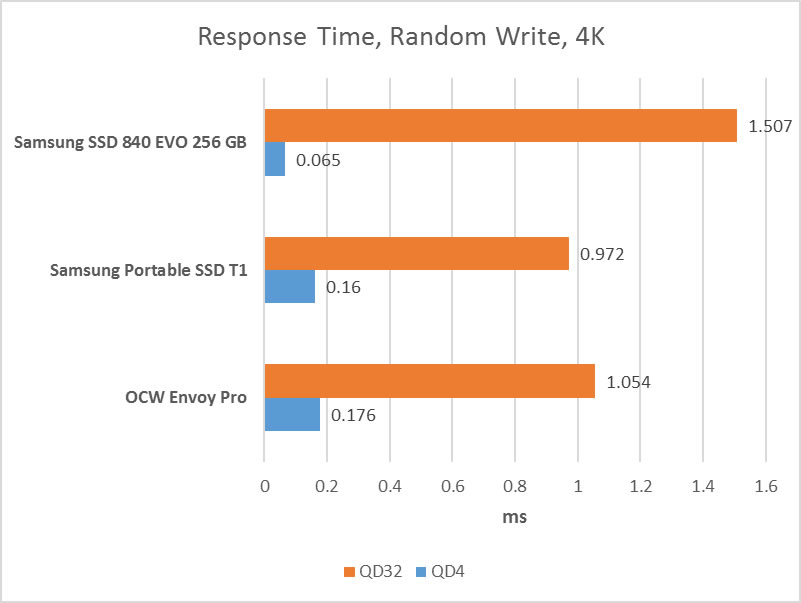
The response time when writing is much closer between the Samsung portable T1 and the OCW Envoy pro even though the Samsung still wins out.
PCMark08

Remember the this benchmark measures the time it takes to complete each task so a lower value is better. As expected the WD My Passport Ultra falls far behind but it is also obvious that even though there are quite a large difference between the Samsung EVO 840 and the Samsung Portable SSD T1 and the Envoy Pro this is not as obvious when looking at these more real world scores. The Evo 840 SSD does score better than the other two but the difference is not that big in most tests. And the Samsung Portable SSD T1 and the OCW Envoy Pro perform very similar. What this benchmark does show is that the Samsung Portable SSD T1 is an excellent choice for an application drive.